Comparative Study
. 2010 Oct;104(4):2063-74.
doi: 10.1152/jn.00474.2010. Epub 2010 Aug 11.

Neuromodulation by GABA converts a relay into a coincidence detector

Affiliations
Comparative Study

Neuromodulation by GABA converts a relay into a coincidence detector

Soham Chanda et al. J Neurophysiol. 2010 Oct.

Abstract

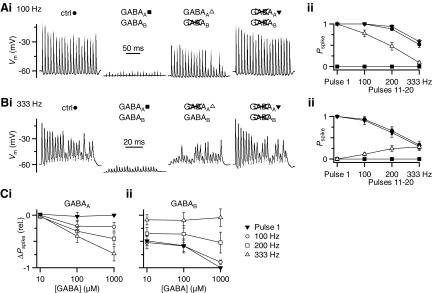
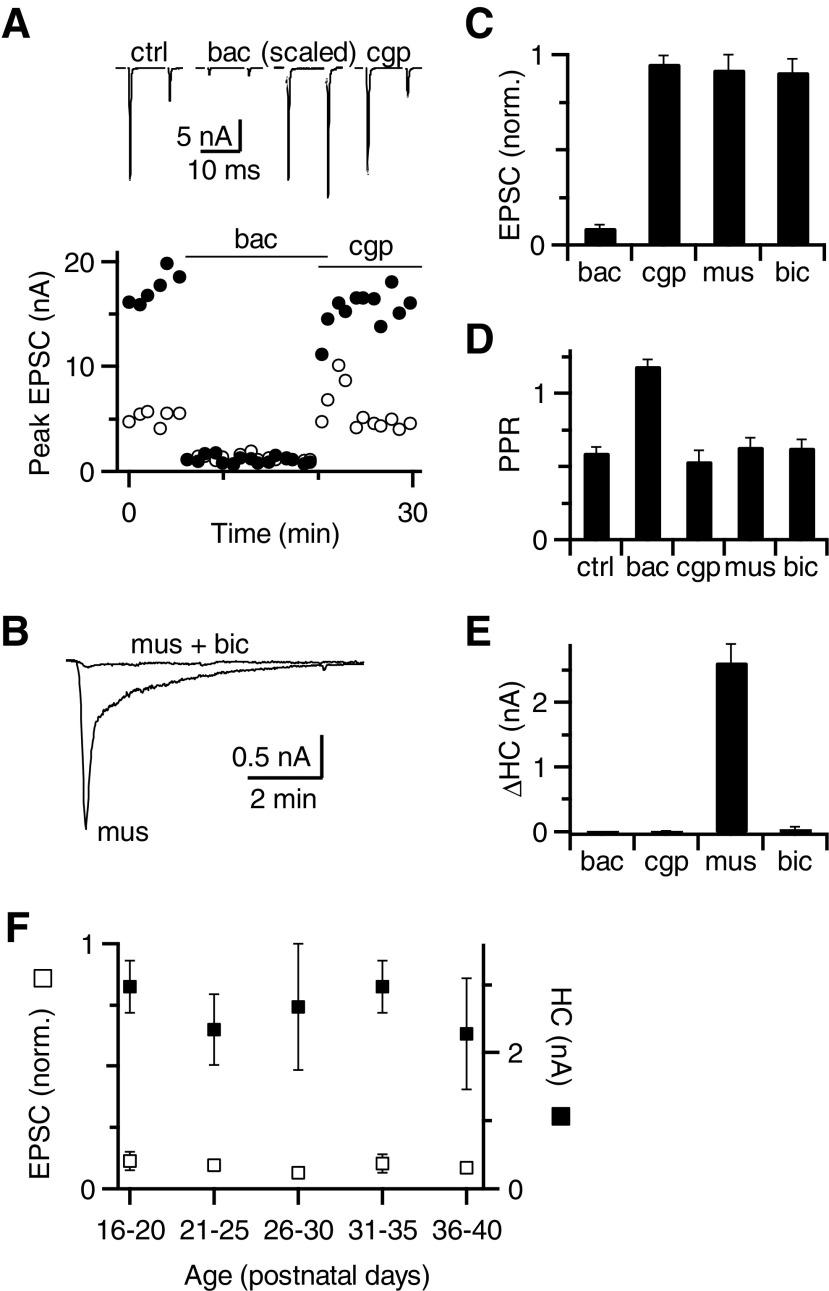
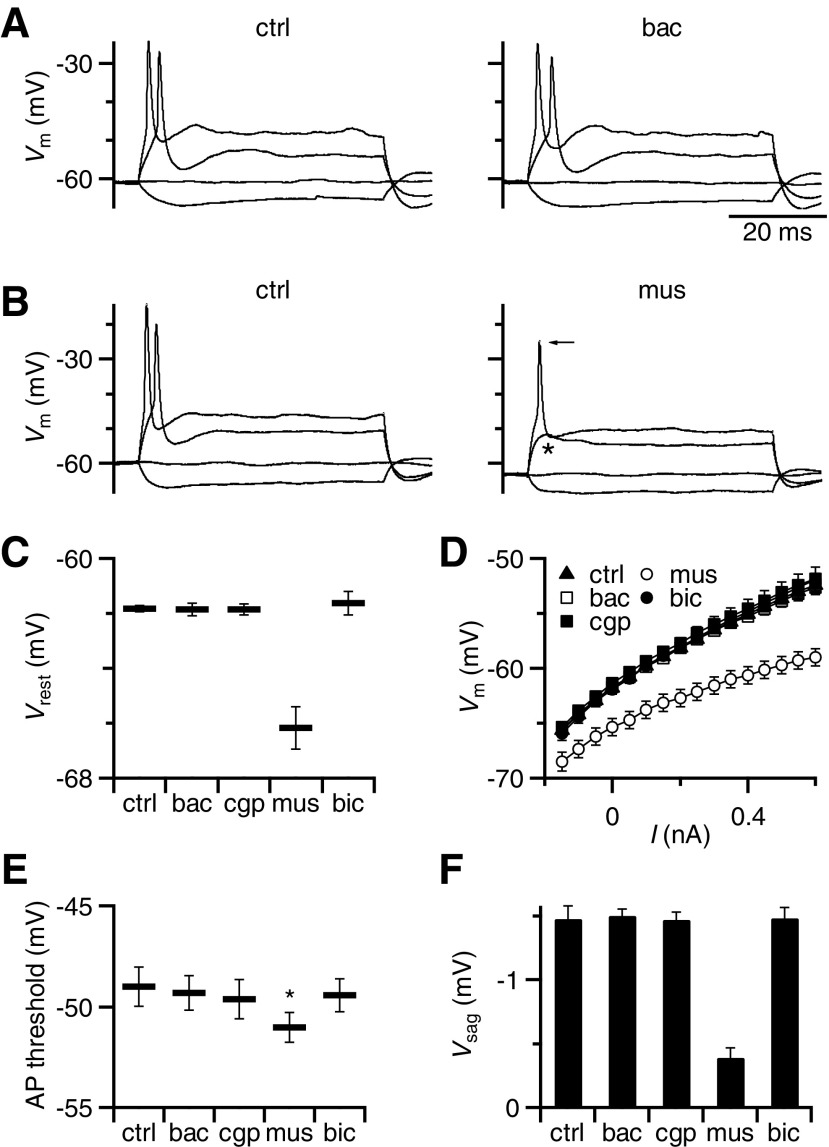
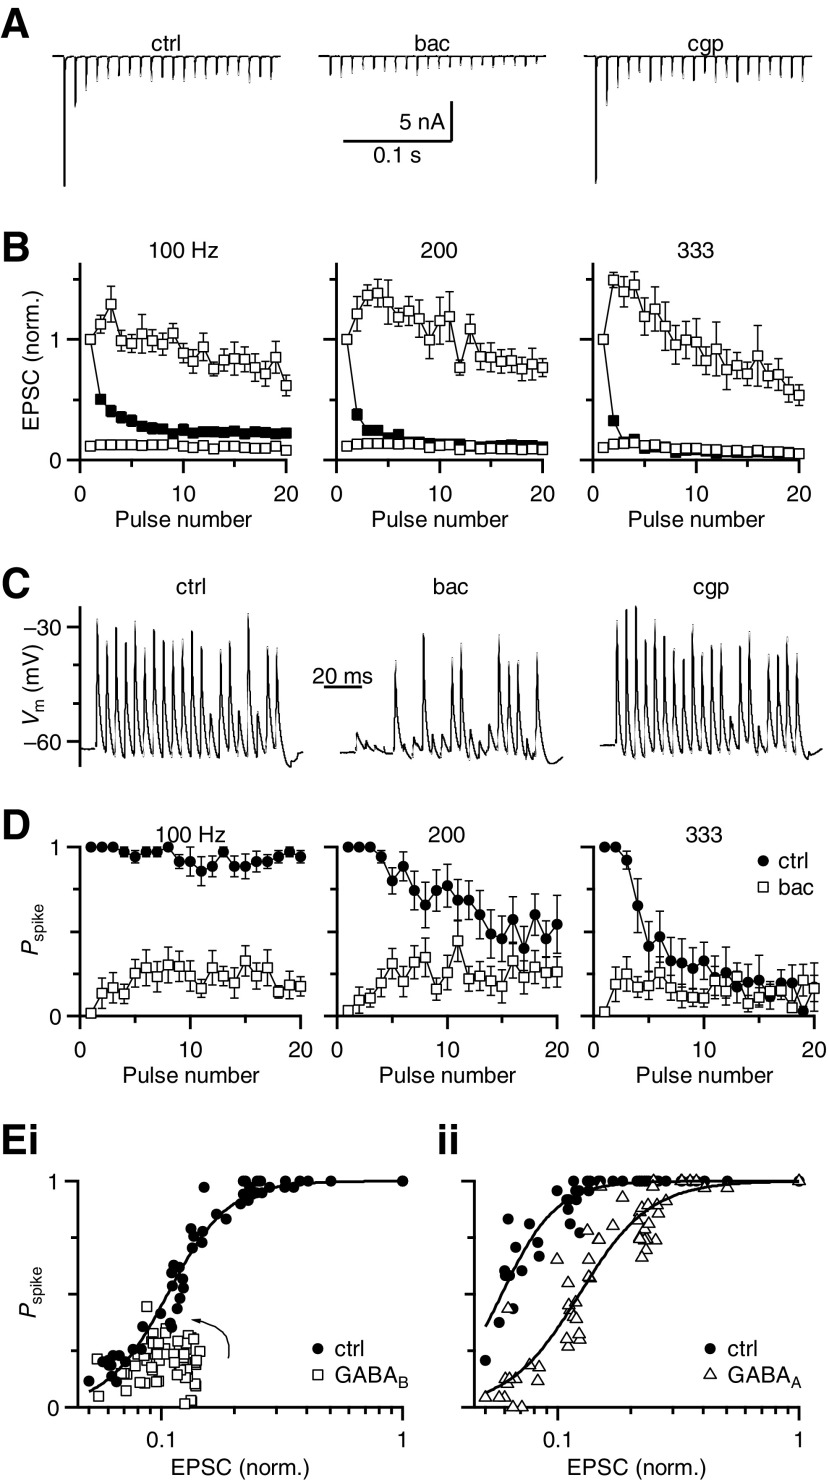
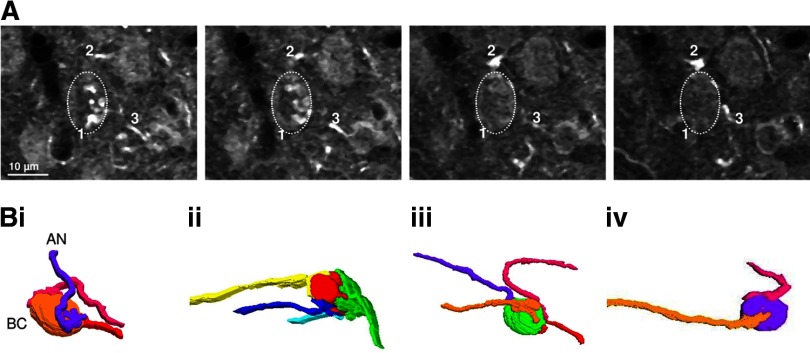
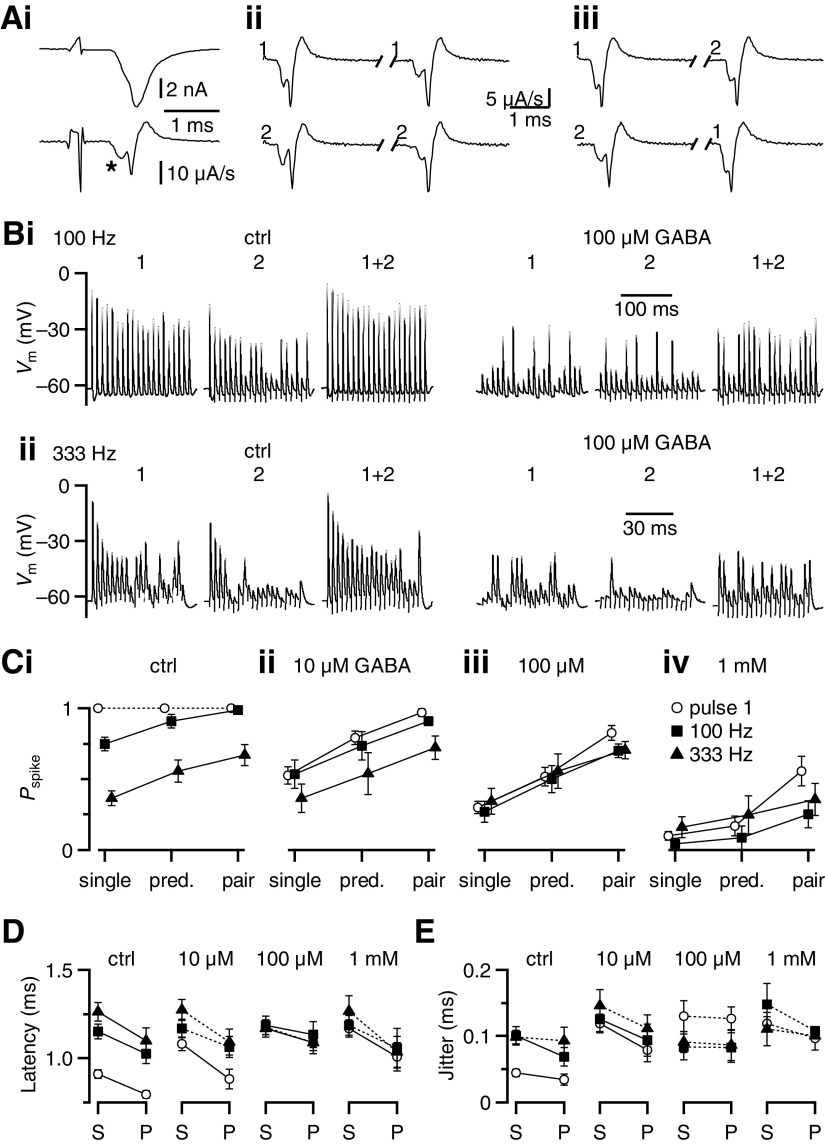
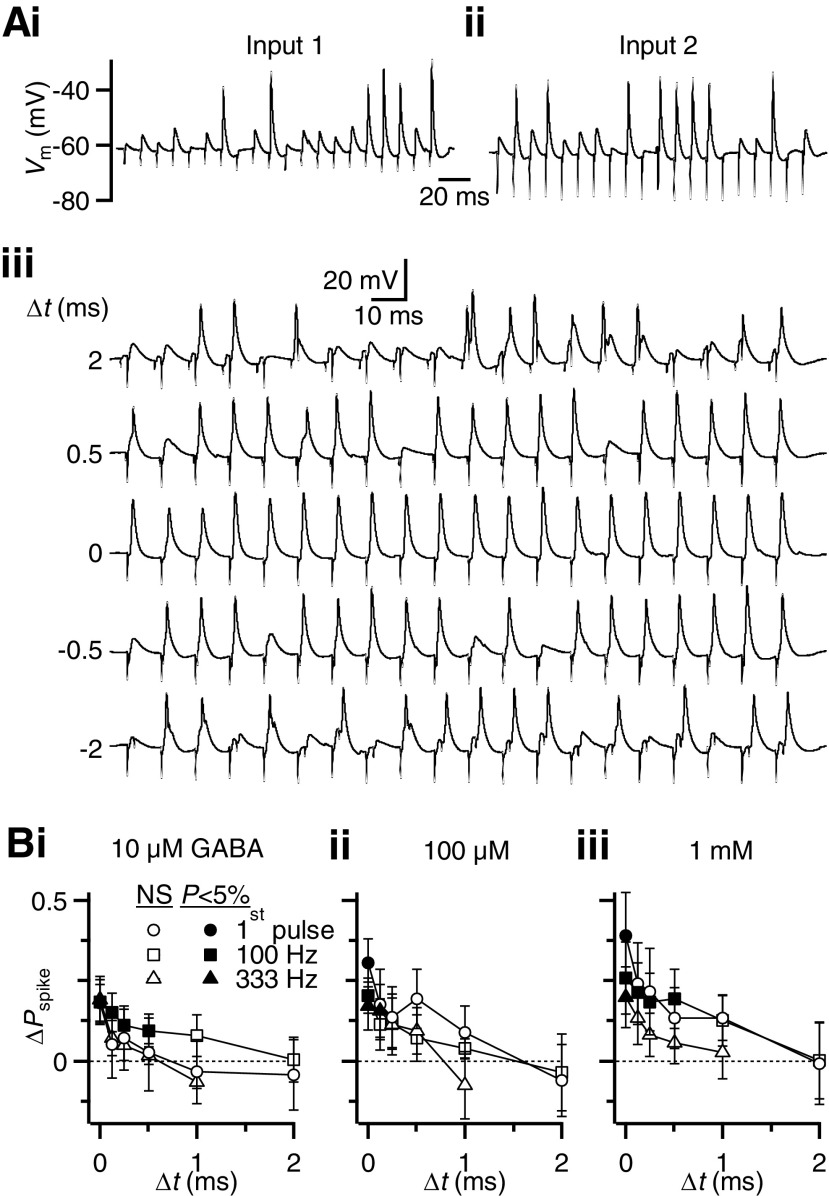
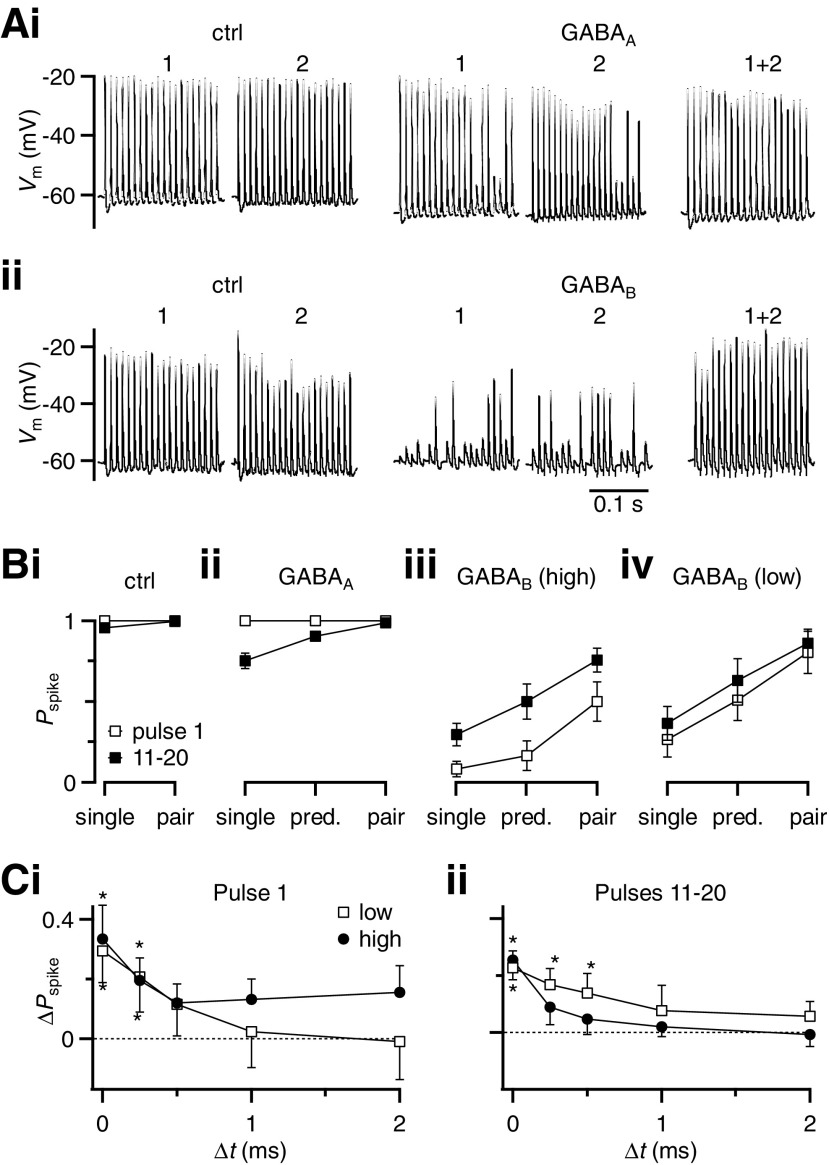
Modulation of synaptic strength by γ-aminobutyric acid receptors (GABARs) is a common feature in sensory pathways that contain relay cell types. However, the functional impact of these receptors on information processing is not clear. We considered this issue at bushy cells (BCs) in the cochlear nucleus, which relay auditory nerve (AN) activity to higher centers. BCs express GABA(A)Rs, and synaptic inputs to BCs express GABA(B)Rs. We tested the effects of GABAR activation on the relaying of AN activity using patch-clamp recordings in mature mouse brain slices at 34°C. GABA affected BC firing in response to trains of AN activity at concentrations as low as 10 μM. GABA(A)Rs reduced firing primarily late in high-frequency trains, whereas GABA(B)Rs reduced firing early and in low-frequency trains. BC firing was significantly restored when two converging AN inputs were activated simultaneously, with maximal effect over a window of <0.5 ms. Thus GABA could adjust the function of BCs, to suppress the relaying of individual inputs and require coincident activity of multiple inputs.


Figures

Fig. 1.
Fig. 1.
Effects of γ-aminobutyric acid receptor (GABAR) activation on bushy cell (BC) firing. Ai: example BC firing pattern for 100-Hz stimulation in control (left), with GABA puff (left, middle), with GABA puff in the presence of CGP55845 (right middle), and with GABA puff in the presence of CGP55845 + bicuculline (right). ii: average effects from 8 experiments similar to i and at different frequencies. BC spike probability (Pspike) is quantified separately for the first pulse in the train (pulse 1) and pulses 11–20 for trains of different frequencies. Symbols match the pharmacological conditions in i. GABA application alone decreases the firing probability throughout the train. CGP55845 completely restores spiking for the first pulse and also significantly increases the spike probability for pulses 11–20 at lower frequencies of stimulation. Bi: similar experiment to A, but showing example traces at 333-Hz stimulation and with the effects of GABA in the presence of bicuculline (right middle) applied before CGP55845. ii: average effects from 8 experiments, similar to i. Bicuculline application restores spiking to control levels for pulses 11–20 at 333 Hz, but has no effect on the first pulse and a weaker effect at 100- and 200-Hz stimulation. C: change in spike probability (ΔPspike) for the experiments in A and B calculated relative to control for GABA application in the presence of (i) CGP55845 to evaluate the contribution of GABAARs or (ii) bicuculline to evaluate the contribution of GABABRs. Changes were quantified as ΔPspike = (Pspikedrug/Pspikectrl) − 1. Each data point is the average of 6–8 cells. GABAAR activation has little effect on the first pulse, but it reduces BC spiking for pulses 11–20. This effect increases with firing frequency and GABA concentration. GABABR activation, by contrast, reduces spiking for pulse 1 as well as throughout the train for lower-frequency stimulation.
Fig. 2.
Fig. 2.
Subtypes of GABARs affecting synaptic transmission. A, top traces: average excitatory postsynaptic currents (EPSCs) in response to paired-pulse stimulation before and after application of baclofen and CGP55845. The EPSCs in baclofen are also shown scaled to the control EPSC1 amplitude. Bottom: peak EPSC amplitude measured during the experiment in response to the first (closed circles) and second (open circles) pulses. B: holding current (HC) in response to muscimol application. Bicuculline blocked the effect of muscimol. C–E: effects of GABAR agonists and antagonists on first EPSC amplitude (C), paired-pulse ratio (PPR, D), and HC (E). Only baclofen had a significant effect on EPSC amplitude and PPR (P < 0.001), which were both reversed by CGP55845 (see results). Only muscimol had a significant effect on HC (P < 0.001), which was reversed by bicuculline. Data are averages of 13 (baclofen and CGP) or 16 (muscimol and bicuculline) cells. F: average effect of baclofen on EPSC amplitude (open squares) and muscimol on HC (closed squares) for slices taken from mice of ages P16–P40. Each data point includes 3–6 cells. There were no significant changes in these effects with age.
Fig. 3.
Fig. 3.
Postsynaptic effects of GABAR activation recorded in current-clamp. A: representative effects of baclofen on BC intrinsic properties. Family of responses to current injections ranging from −150 to 600 pA, showing no differences between control conditions (left) and in the presence of baclofen (right). The small depolarization that occurs during hyperpolarizing current pulses (the “sag” potential) reflects Ih activation (see results). B: same experiment as in A, but using muscimol application. Muscimol hyperpolarized the cell, increased the membrane conductance, blocked action potential (AP) firing (asterisk), and decreased the sag potential (Vsag) in response to hyperpolarization. There was also a small decrease in spike amplitude (arrow). C–F: average effects of GABAR agonists and antagonists on BC resting membrane potential (C), input resistance (D), AP threshold (E), and sag potential (F). Muscimol had a significant effect on each of these properties, but baclofen did not. Points are the averages of 8–9 experiments.
Fig. 4.
Fig. 4.
Changes in the BC input–output function after GABAR activation. A: example traces showing the effect of baclofen during a 100-Hz train of activity. Baclofen application significantly reduced EPSC amplitudes throughout the train. B: average EPSC amplitudes for different stimulation frequencies in control conditions (closed symbols) and in the presence of baclofen (open symbols). The top open symbols are normalized to EPSC1 in baclofen (EPSCibac/EPSC1bac), whereas the lower open symbols are normalized to EPSC1 in control (EPSCibac/EPSC1ctrl) (n = 7 cells). C: example traces showing high reliability during a 200-Hz train in control conditions (left), that decreased in baclofen (middle) and recovered in CGP55845. D: average BC firing probability (Pspike) throughout the train before and after baclofen application for different stimulation frequencies (n = 7 cells). Firing probability is reduced by baclofen at all frequencies. E: BC input–output function. i: Pspike after GABABR activation was plotted against normalized EPSC amplitudes from B. Pspike values were drawn from experiments using either bath-applied baclofen or puffed 1 mM GABA + bicuculline. Because these data are taken from trains of activation, there is also an activity-dependent effect, which is more obvious in the GABAB input–output curve. EPSCs begin at very low efficacy and increase somewhat during the train to approach the control curve (arrow). ii: Pspike after GABAAR activation was plotted against control EPSC data from B (because GABAAR activation does not change EPSC amplitude). Pspike values after GABAAR activation were drawn from puff experiments using 1 mM GABA in the presence of CGP55845. Pspike values for control conditions (open symbols) are derived from experiments before the respective GABAR activation. Error bars have been omitted for the sake of clarity. The data are fit using a Hill equation (see results).
Fig. 5.
Fig. 5.
Multiple auditory nerve (AN) fibers converge on mouse BCs. A: 4 optical sections at 0.84-μm intervals taken from mouse AVCN labeled with an anti-calretinin antibody imaged with a confocal microscope. The dashed oval indicates a BC. Endbulbs were identified by their morphology and proximity to the BC and then traced back to their origin at distinct AN fibers. Different fibers are marked with different numbers. B: reconstructed images of 4 BCs and their AN inputs.
Fig. 6.
Fig. 6.
BC spiking is restored by simultaneous activity in 2 inputs. A: representative traces indicating the method of isolating 2 inputs using a potassium-based internal in voltage clamp. i: stimulation yields an EPSC with a superimposed spike (top trace) that can be better distinguished using the first derivative (bottom trace). The EPSC is indicated by an asterisk. Activation of each pathway at 10-ms interval showed paired-pulse depression (ii), but there was no depression when each pathway was stimulated alternately (iii), indicating they are separate inputs. B: representative traces showing the effects of 100 μM GABA on responses to single and paired stimulation in 2 different frequency trains. Responses to each individual input are shown in the 2 left traces in control conditions, with paired stimulation in the third traces. The next 2 traces show reduced spiking after GABA application. The rightmost trace shows that spiking is restored when both inputs are stimulated during GABAR activation. C: average effects of GABAR activation for single and paired stimulation on the probability of BC spiking using different concentrations of GABA: ctrl (i), 10 μM (ii), 100 μM (iii), and 1 mM (iv). Each point is the average of 7 or 8 cells. The “predicted” value represents the enhanced firing probability that is expected to result from spike summation, calculated from the responses to single inputs (see results). The additional enhancement seen with paired stimulation results from excitatory postsynaptic potential (EPSP) summation. The firing probability increased significantly (P < 0.05) comparing between single and paired stimulation as well as between predicted and paired stimulation for all the conditions tested, except for pulse 1 in control, where firing probability was 100%. D and E: average effects of GABA application on the spike latency (D) and jitter (E) for single (“S”) or paired (“P”) stimuli. Each point represents averages of 5 to 8 cells. In some experiments, latency and jitter could not be calculated because of significant failure in AP firing. Significance (P < 0.05) is indicated by solid lines.
Fig. 7.
Fig. 7.
BC firing in response to 2 inputs requires precise coincidence when GABARs are activated. A: representative responses to stimulation of each input individually (i, ii) and to paired stimulation for different intervals (iii) during bath application of 100 μM GABA. Stimulus artifacts are visible as rapid downward deflections. B: change in BC spike probability (ΔPspike) as a function of the time interval (Δt) between 2 inputs. Values are calculated relative to the predicted Pspike that results from spike summation (see results). Filled symbols indicate Pspike values that are significantly above the value predicted for spike summation. The extent of enhancement appears to increase with GABA concentration, but the τ values of decay do not change significantly. Points are averages of 7 or 8 experiments.
Fig. 8.
Fig. 8.
The effects of GABA on coincidence detection are primarily mediated through GABABRs. A: representative traces showing the effects of GABAAR (i) and GABABR (ii) activation on single and paired stimulation in 100-Hz trains. Responses to each individual input in control conditions are shown in the 2 left traces. The next 2 traces show reduced spiking during GABAR activation. The rightmost trace shows that spiking is restored when both inputs are stimulated during GABAR activation. GABAAR activation (i) was done by puffing 1 mM GABA in the presence of CGP55845. GABABR activation (ii) was done by bath application of baclofen. B: average effects of GABAAR (ii) and GABABR (iii, iv) activation for single and paired stimulation on the probability of BC spiking. GABAAR activation (ii) was done by puffing 1 mM GABA in the presence of CGP55845 (6 cells). GABABR activation was done by bath application either of baclofen (iii, “high”; n = 11 cells) or of 10 μM GABA in the presence of bicuculline (iv, “low”; n = 5 cells). Pspike increased significantly from single to paired stimulation under all conditions of GABAR activation (P < 0.02), but not in control. The effects of GABAAR activation are weaker than GABABR activation. C: enhancement of BC spike probability (ΔPspike), for 2 inputs stimulated at different time intervals during GABABR activation. GABABRs were activated using bath application of baclofen (closed circles, “high,” 6 to 11 cells for each point) or 10 μM GABA in the presence of bicuculline (open squares, “low,” 5 cells). ΔPspike is calculated relative to the value predicted for spike summation. Asterisks indicate values significantly different from 0.

Similar articles

Cited by

References

    1. Adams JC, Mugnaini E. Patterns of glutamate decarboxylase immunostaining in the feline cochlear nuclear complex studied with silver enhancement and electron microscopy. J Comp Neurol 262: 375–401, 1987. - PubMed
    1. Agmon-Snir H, Carr CE, Rinzel J. The role of dendrites in auditory coincidence detection. Nature 393: 268–272, 1998. - PubMed
    1. Bean BP. Neurotransmitter inhibition of neuronal calcium currents by changes in channel voltage dependence. Nature 340: 153–156, 1989. - PubMed
    1. Bellingham MC, Walmsley B. A novel presynaptic inhibitory mechanism underlies paired pulse depression at a fast central synapse. Neuron 23: 159–170, 1999. - PubMed
    1. Benson CG, Potashner SJ. Retrograde transport of [3H]glycine from the cochlear nucleus to the superior olive in the guinea pig. J Comp Neurol 296: 415–426, 1990. - PubMed

Publication types

MeSH terms

LinkOut - more resources