

Identification of essential filovirion-associated host factors by serial proteomic analysis and RNAi screen
- PMID: 20702783
- PMCID: PMC3101857
- DOI: 10.1074/mcp.M110.003418
Identification of essential filovirion-associated host factors by serial proteomic analysis and RNAi screen
Abstract
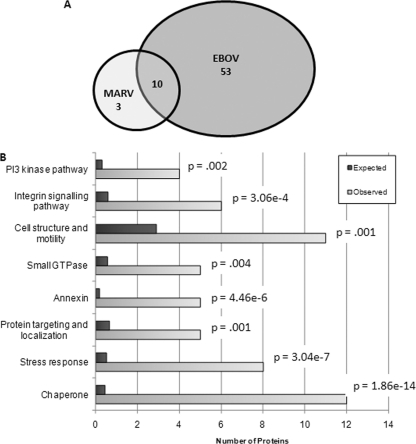
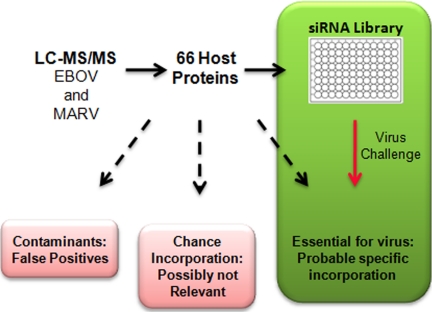
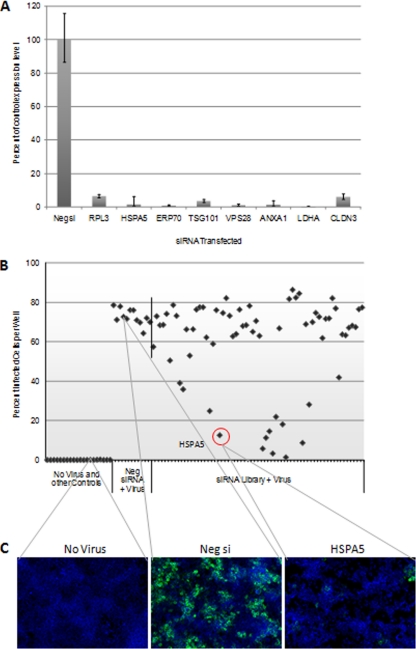
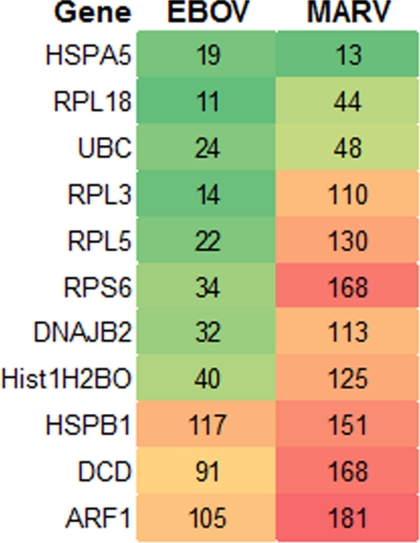
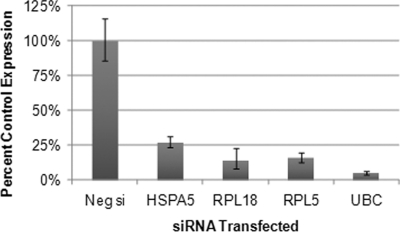
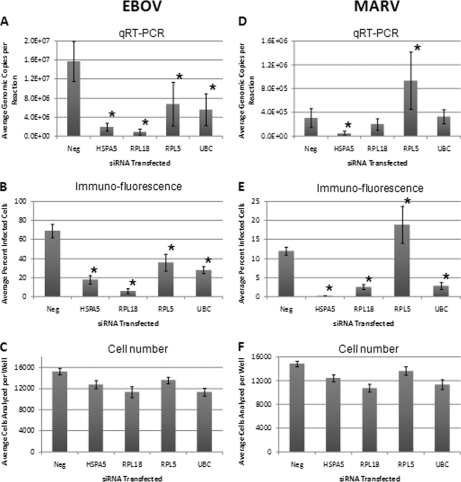
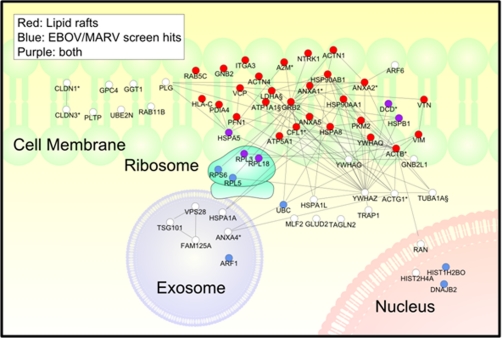
An assessment of the total protein composition of filovirus (ebolavirus and marburgvirus) virions is currently lacking. In this study, liquid chromatography-linked tandem mass spectrometry of purified ebola and marburg virions was performed to identify associated cellular proteins. Host proteins involved in cell adhesion, cytoskeleton, cell signaling, intracellular trafficking, membrane organization, and chaperones were identified. Significant overlap exists between this data set and proteomic studies of disparate viruses, including HIV-1 and influenza A, generated in multiple cell types. However, the great majority of proteins identified here have not been previously described to be incorporated within filovirus particles. Host proteins identified by liquid chromatography-linked tandem mass spectrometry could lack biological relevance because they represent protein contaminants in the virus preparation, or because they are incorporated within virions by chance. These issues were addressed using siRNA library-mediated gene knockdown (targeting each identified virion-associated host protein), followed by filovirus infection. Knockdown of several host proteins (e.g. HSPA5 and RPL18) significantly interfered with ebolavirus and marburgvirus infection, suggesting specific and relevant virion incorporation. Notably, select siRNAs inhibited ebolavirus, but enhanced marburgvirus infection, suggesting important differences between the two viruses. The proteomic analysis presented here contributes to a greater understanding of filovirus biology and potentially identifies host factors that can be targeted for antiviral drug development.
Figures
Similar articles
-
Pox proteomics: mass spectrometry analysis and identification of Vaccinia virion proteins.Virol J. 2006 Mar 1;3:10. doi: 10.1186/1743-422X-3-10. Virol J. 2006. PMID: 16509968 Free PMC article.
-
Identity and validity of conserved B cell epitopes of filovirus glycoprotein: towards rapid diagnostic testing for Ebola and possibly Marburg virus disease.BMC Infect Dis. 2018 Oct 3;18(1):498. doi: 10.1186/s12879-018-3409-x. BMC Infect Dis. 2018. PMID: 30285648 Free PMC article.
-
Proteomics of HCV virions reveals an essential role for the nucleoporin Nup98 in virus morphogenesis.Proc Natl Acad Sci U S A. 2016 Mar 1;113(9):2484-9. doi: 10.1073/pnas.1518934113. Epub 2016 Feb 16. Proc Natl Acad Sci U S A. 2016. PMID: 26884193 Free PMC article.
-
Filovirus proteins for antiviral drug discovery: Structure/function bases of the replication cycle.Antiviral Res. 2017 May;141:48-61. doi: 10.1016/j.antiviral.2017.02.004. Epub 2017 Feb 10. Antiviral Res. 2017. PMID: 28192094 Review.
-
Filovirus proteins for antiviral drug discovery: Structure/function of proteins involved in assembly and budding.Antiviral Res. 2018 Feb;150:183-192. doi: 10.1016/j.antiviral.2017.12.022. Epub 2018 Jan 2. Antiviral Res. 2018. PMID: 29305306 Review.
Cited by
-
GRP78/Dna K Is a Target for Nexavar/Stivarga/Votrient in the Treatment of Human Malignancies, Viral Infections and Bacterial Diseases.J Cell Physiol. 2015 Oct;230(10):2552-78. doi: 10.1002/jcp.25014. J Cell Physiol. 2015. PMID: 25858032 Free PMC article.
-
HSPA5/Dna K may be a useful target for human disease therapies.DNA Cell Biol. 2015 Mar;34(3):153-8. doi: 10.1089/dna.2015.2808. DNA Cell Biol. 2015. PMID: 25689303 Free PMC article.
-
Disruption of Ebola NP0VP35 Inclusion Body-like Structures reduce Viral Infection.J Mol Biol. 2023 Oct 15;435(20):168241. doi: 10.1016/j.jmb.2023.168241. Epub 2023 Aug 19. J Mol Biol. 2023. PMID: 37598728 Free PMC article.
-
OSU-03012 and Viagra Treatment Inhibits the Activity of Multiple Chaperone Proteins and Disrupts the Blood-Brain Barrier: Implications for Anti-Cancer Therapies.J Cell Physiol. 2015 Aug;230(8):1982-98. doi: 10.1002/jcp.24977. J Cell Physiol. 2015. PMID: 25736380 Free PMC article.
-
Ebolavirus nucleoprotein C-termini potently attract single domain antibodies enabling monoclonal affinity reagent sandwich assay (MARSA) formulation.PLoS One. 2013;8(4):e61232. doi: 10.1371/journal.pone.0061232. Epub 2013 Apr 5. PLoS One. 2013. PMID: 23577211 Free PMC article.
References
-
- Chertova E., Chertov O., Coren L. V., Roser J. D., Trubey C. M., Bess J. W., Jr., Sowder R. C., 2nd, Barsov E., Hood B. L., Fisher R. J., Nagashima K., Conrads T. P., Veenstra T. D., Lifson J. D., Ott D. E. (2006) Proteomic and biochemical analysis of purified human immunodeficiency virus type 1 produced from infected monocyte-derived macrophages. J. Virol. 80, 9039–9052 - PMC - PubMed
Publication types
MeSH terms
Substances
LinkOut - more resources
Full Text Sources
Other Literature Sources
Miscellaneous
