

Fluorogenic Tagging of Peptide and Protein 3-Nitrotyrosine with 4-(Aminomethyl)-benzenesulfonic Acid for Quantitative Analysis of Protein Tyrosine Nitration
- PMID: 20703364
- PMCID: PMC2918916
- DOI: 10.1365/s10337-009-1409-0
Fluorogenic Tagging of Peptide and Protein 3-Nitrotyrosine with 4-(Aminomethyl)-benzenesulfonic Acid for Quantitative Analysis of Protein Tyrosine Nitration
Abstract
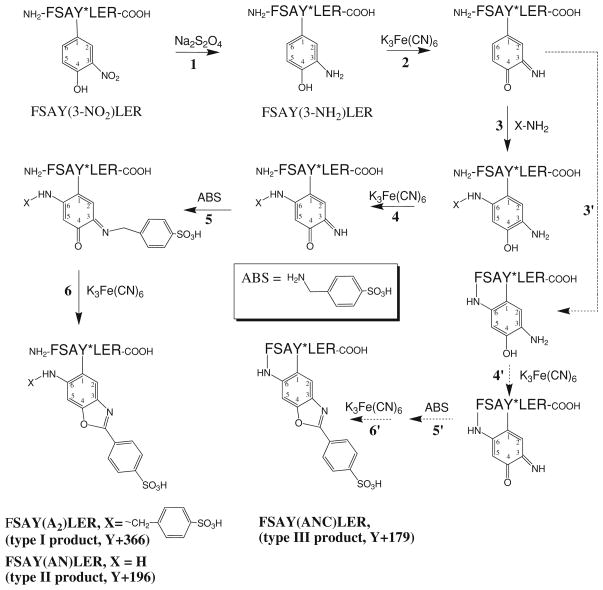
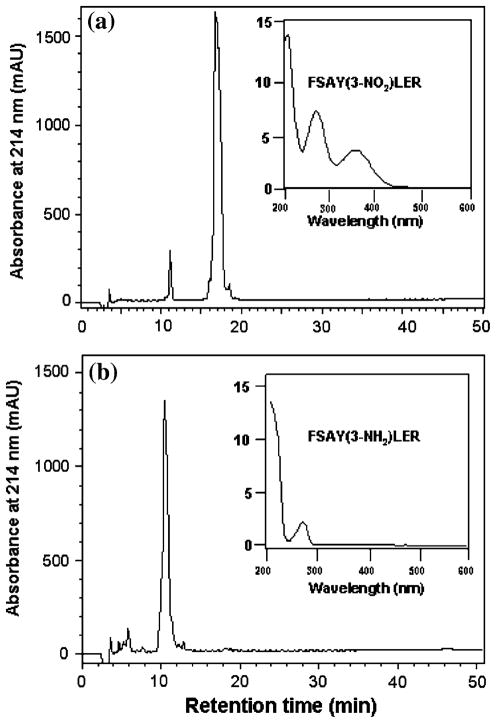
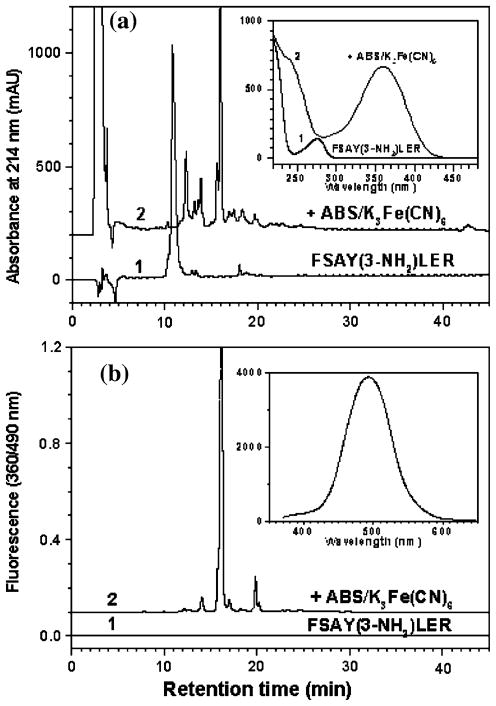
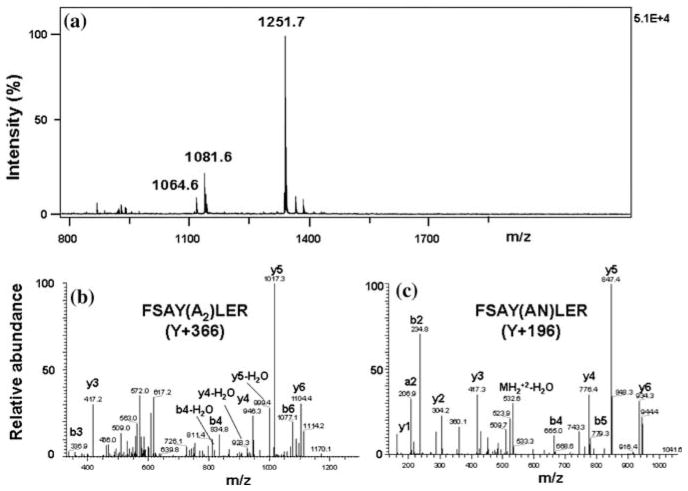
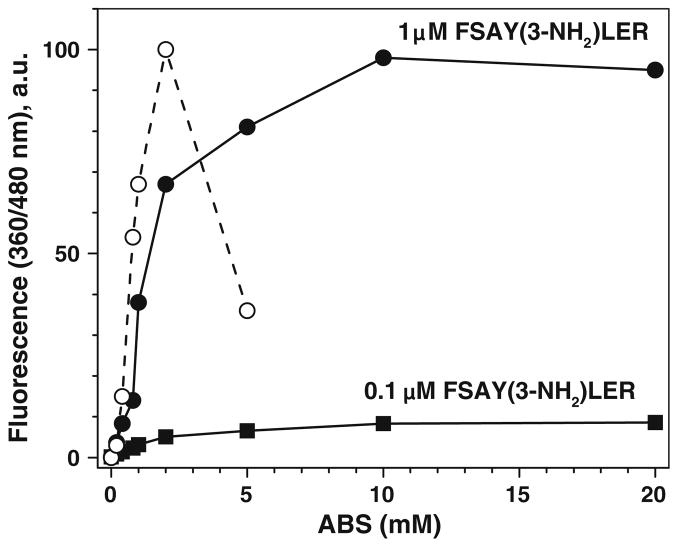
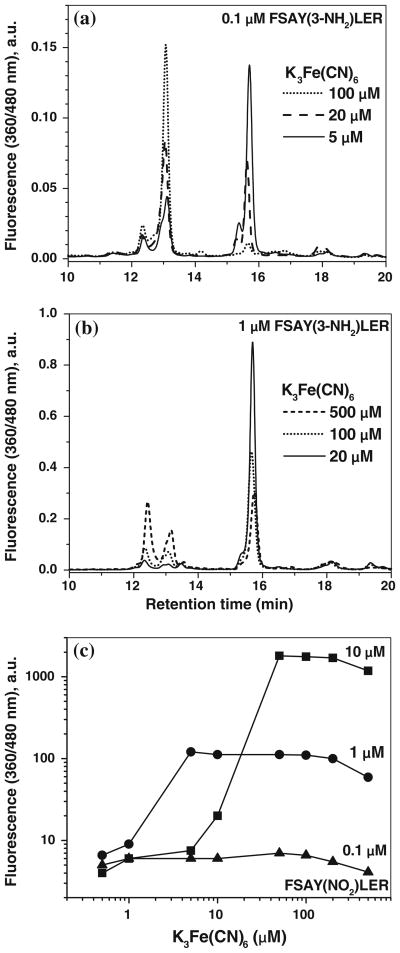
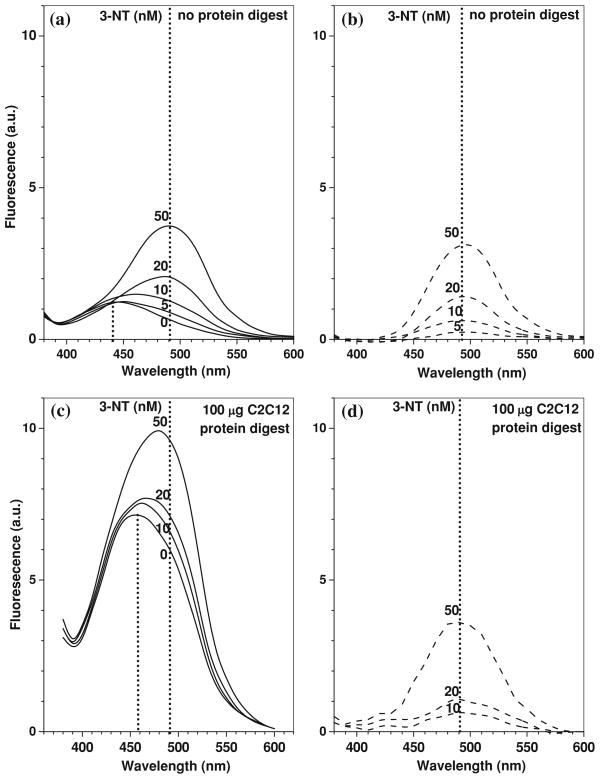
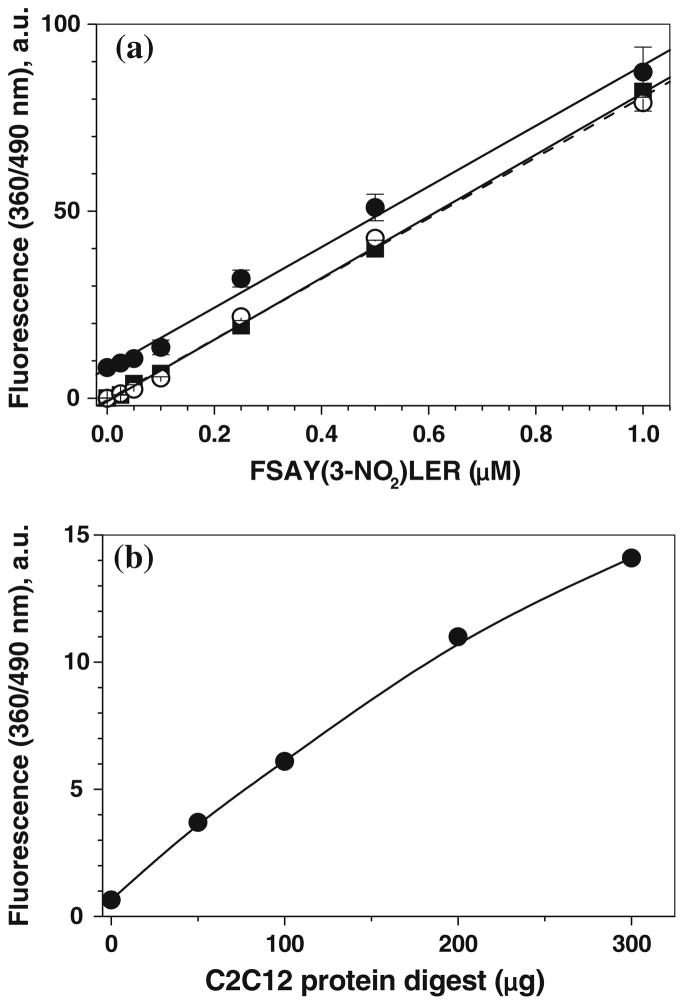
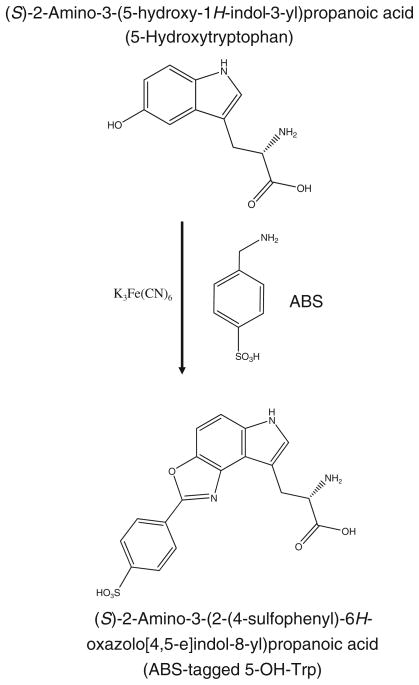
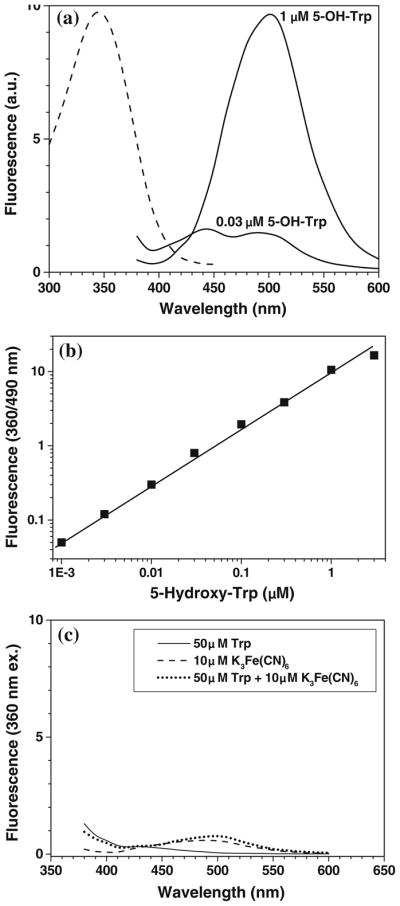
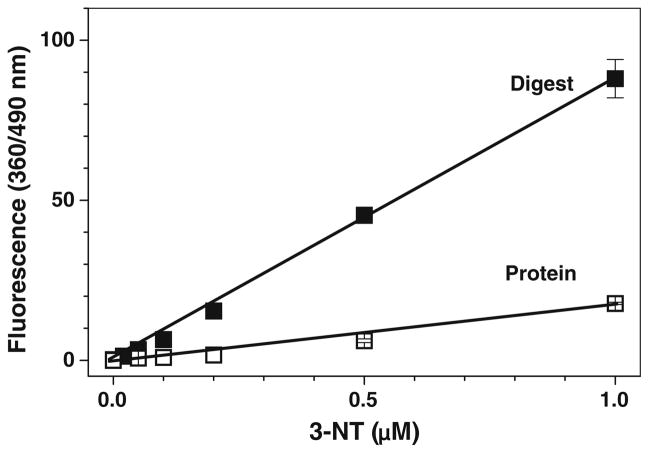
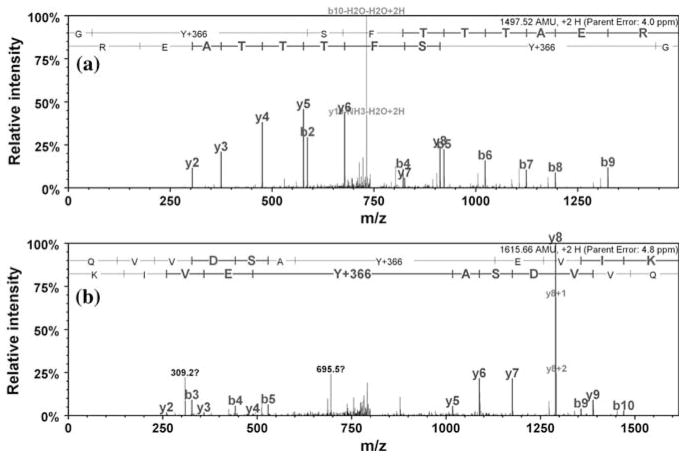
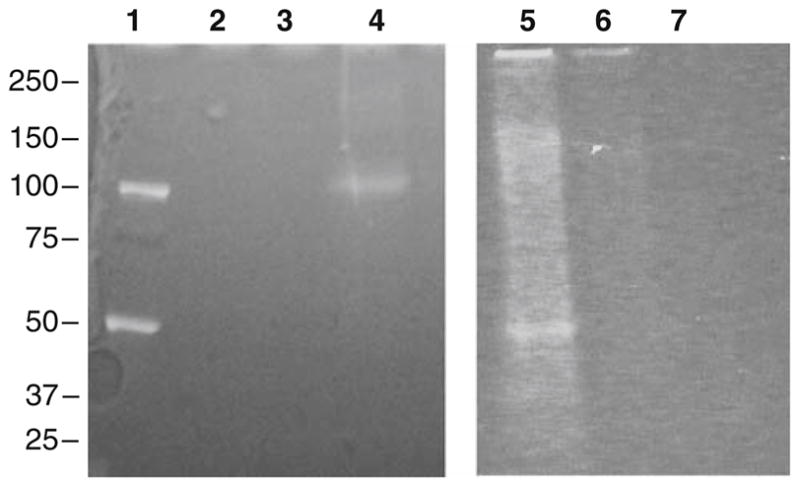
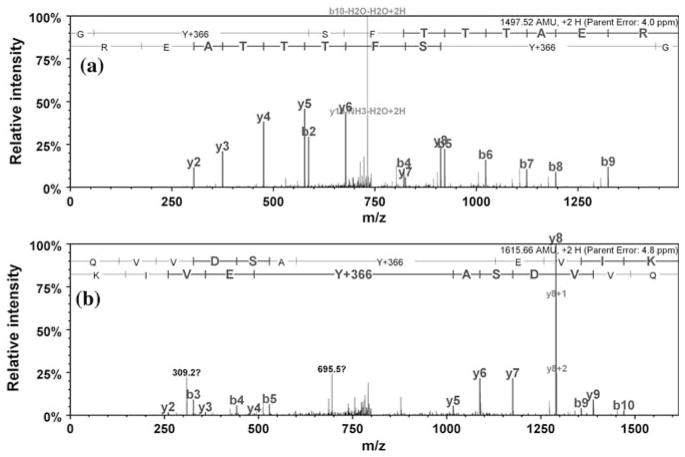
Protein 3-nitrotyrosine (3-NT) has been recognized as an important biomarker of nitroxidative stress associated with inflammatory and degenerative diseases, and biological aging. Analysis of protein-bound 3-NT continues to represent a challenge since in vivo it frequently does not accumulate on proteins in amounts detectable by quantitative analytical methods. Here, we describe a novel approach of fluorescent tagging and quantitation of peptide-bound 3-NT residues based on the selective reduction to 3-AT followed by reaction with 4-(amino-methyl)benzenesulfonic acid (ABS) in the presence of K(3)Fe(CN)(6) to form a highly fluorescent 2-phenylbenzoxazole product. Synthetic 3-NT peptide (0.005-1 μM) upon reduction with 10 mM sodium dithionite and tagging with 2 mM ABS and 5 μM K(3)Fe(CN)(6) in 0.1 M Na(2)HPO(4) buffer (pH 9.0) was converted with yields >95% to a single fluorescent product incorporating two ABS molecules per 3-NT residue, with fluorescence excitation and emission maxima at 360 ± 2 and 490 ± 2 nm, respectively, and a quantum yield of 0.77 ± 0.08, based on reverse-phase LC with UV and fluorescence detection, fluorescence spectroscopy and LC-MS-MS analysis. This protocol was successfully tested for quantitative analysis of in vitro Tyr nitration in a model protein, rabbit muscle phosphorylase b, and in a complex mixture of proteins from C2C12 cultured cells exposed to peroxynitrite, with a detection limit of ca. 1 pmol 3-NT by fluorescence spectrometry, and an apparent LOD of 12 and 40 pmol for nitropeptides alone or in the presence of 100 μg digested cell proteins, respectively. LC-MS-MS analysis of ABS tagged peptides revealed that the fluorescent derivatives undergo efficient backbone fragmentations, allowing for sequence-specific characterization of protein Tyr nitration in proteomic studies. Fluorogenic tagging with ABS also can be instrumental for detection and visualization of protein 3-NT in LC and gel-based protein separations.
Figures

Similar articles
-
A methodology for simultaneous fluorogenic derivatization and boronate affinity enrichment of 3-nitrotyrosine-containing peptides.Anal Biochem. 2011 Nov 15;418(2):184-96. doi: 10.1016/j.ab.2011.07.024. Epub 2011 Jul 28. Anal Biochem. 2011. PMID: 21855526 Free PMC article.
-
Fluorogenic tagging of protein 3-nitrotyrosine with 4-(aminomethyl)benzene sulfonate in tissues: a useful alternative to Immunohistochemistry for fluorescence microscopy imaging of protein nitration.Free Radic Biol Med. 2012 Nov 15;53(10):1877-85. doi: 10.1016/j.freeradbiomed.2012.08.582. Epub 2012 Aug 31. Free Radic Biol Med. 2012. PMID: 22995636 Free PMC article.
-
Age-associated tyrosine nitration of rat skeletal muscle glycogen phosphorylase b: characterization by HPLC-nanoelectrospray-tandem mass spectrometry.Exp Gerontol. 2006 Apr;41(4):407-16. doi: 10.1016/j.exger.2006.02.012. Epub 2006 Apr 17. Exp Gerontol. 2006. PMID: 16616821
-
Recent methodological advances in the mass spectrometric analysis of free and protein-associated 3-nitrotyrosine in human plasma.J Chromatogr B Analyt Technol Biomed Life Sci. 2005 Jan 5;814(1):1-9. doi: 10.1016/j.jchromb.2004.10.003. J Chromatogr B Analyt Technol Biomed Life Sci. 2005. PMID: 15607702 Review.
-
Mass spectrometry and 3-nitrotyrosine: strategies, controversies, and our current perspective.Mass Spectrom Rev. 2014 Jul-Aug;33(4):237-76. doi: 10.1002/mas.21396. Epub 2013 Oct 24. Mass Spectrom Rev. 2014. PMID: 24167057 Review.
Cited by
-
Xanthine oxidase-mediated oxidative stress promotes cancer cell-specific apoptosis.Free Radic Biol Med. 2019 Aug 1;139:70-79. doi: 10.1016/j.freeradbiomed.2019.05.019. Epub 2019 May 16. Free Radic Biol Med. 2019. PMID: 31103463 Free PMC article.
-
Effect of Iron Oxide Nanoparticles on the Oxidation and Secondary Structure of Growth Hormone.J Pharm Sci. 2019 Oct;108(10):3372-3381. doi: 10.1016/j.xphs.2019.06.007. Epub 2019 Jun 16. J Pharm Sci. 2019. PMID: 31216451 Free PMC article.
-
Comparative Evaluation of the Chemical Stability of 4 Well-Defined Immunoglobulin G1-Fc Glycoforms.J Pharm Sci. 2016 Feb;105(2):575-587. doi: 10.1016/j.xphs.2015.10.024. Epub 2016 Jan 11. J Pharm Sci. 2016. PMID: 26869420 Free PMC article.
-
Nitric oxide-dependent posttranslational modification in plants: an update.Int J Mol Sci. 2012 Nov 16;13(11):15193-208. doi: 10.3390/ijms131115193. Int J Mol Sci. 2012. PMID: 23203119 Free PMC article. Review.
-
Identification of oxidation sites and covalent cross-links in metal catalyzed oxidized interferon Beta-1a: potential implications for protein aggregation and immunogenicity.Mol Pharm. 2013 Jun 3;10(6):2311-22. doi: 10.1021/mp300665u. Epub 2013 May 2. Mol Pharm. 2013. PMID: 23534382 Free PMC article.
References
Grants and funding
LinkOut - more resources
Full Text Sources
Research Materials