

doi: 10.1086/655810.
School opening dates predict pandemic influenza A(H1N1) outbreaks in the United States
Affiliations
- PMID: 20704486
- PMCID: PMC2939723
- DOI: 10.1086/655810
Item in Clipboard
School opening dates predict pandemic influenza A(H1N1) outbreaks in the United States
J Infect Dis.
.
Abstract
The opening of schools in the late summer of 2009 may have triggered the fall wave of pandemic influenza A(H1N1) in the United States. We found that an elevated percentage of outpatient visits for influenza-like illness occurred an average of 14 days after schools opened in the fall of 2009. The timing of these events was highly correlated (Spearman correlation coefficient, 0.62; P<.001). This result provides evidence that transmission in schools catalyzes community-wide transmission. School opening dates can be useful for future pandemic planning, and influenza mitigation strategies should be targeted at school populations before the influenza season.
Figures
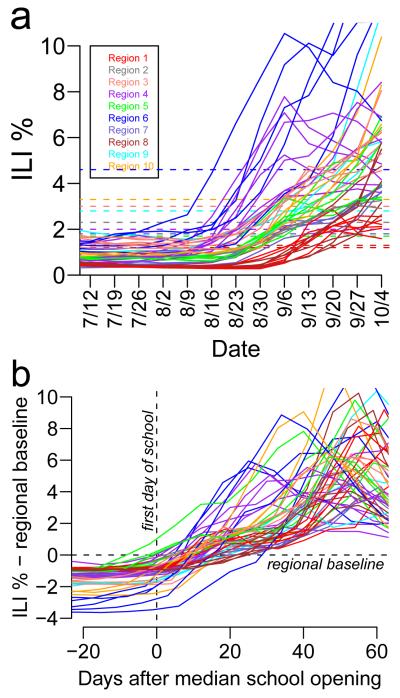
(a) Weekly ILI% data by state. The regional baselines for the 2009–2010 influenza season are shown as horizontal dashed lines. The regional baselines and weekly ILI% by state are color-coded by influenza surveillance region as shown in the legend. (b) ILI% data relative to the states’ school opening dates. The x-axis represents the number of days relative to a state’s median school opening day, and the y-axis represents the ILI% of a state minus the appropriate regional baseline.

The date on which the ILI% of a state exceeds its regional baseline is represented on the y-axis. Each point represents a state, the solid line is the linear regression fit (y = 0.69x + 20.33), and the dashed lines are the 95% confidence envelope.
References
-
- Monto AS, Koopman JS, Longini IM., Jr Tecumseh study of illness. XIII. Influenza infection and disease, 1976-1981. Am J Epidemiol. 1985 Jun;121(6):811–22. - PubMed
-
- Centers for Disease Control and Prevention Update: influenza activity–United States, April-August 2009. MMWR Morb Mortal Wkly Rep. 2009 Sep 18;58(36):1009–12. - PubMed
-
- Henderson DA, Courtney B, Inglesby TV, Toner E, Nuzzo JB. Public health and medical responses to the 1957-58 influenza pandemic. Biosecur Bioterror. 2009 Sep;7(3):265–73. - PubMed
Publication types
MeSH terms
Grants and funding
LinkOut - more resources
Full Text Sources
Other Literature Sources
Medical
