. 2010 Aug;32(3):347-58.
doi: 10.1111/j.1460-9568.2010.07303.x.

Decoding glutamate receptor activation by the Ca2+ sensor protein hippocalcin in rat hippocampal neurons

Affiliations
Free PMC article

Decoding glutamate receptor activation by the Ca2+ sensor protein hippocalcin in rat hippocampal neurons

A V Dovgan et al. Eur J Neurosci. 2010 Aug.
Free PMC article

Abstract

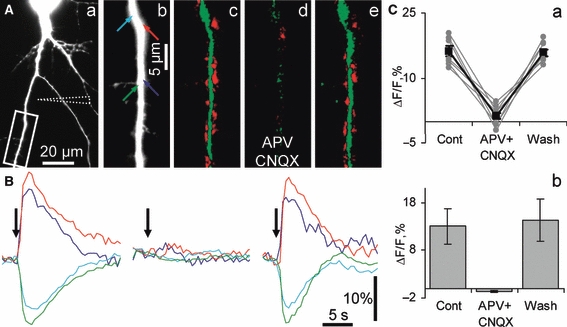
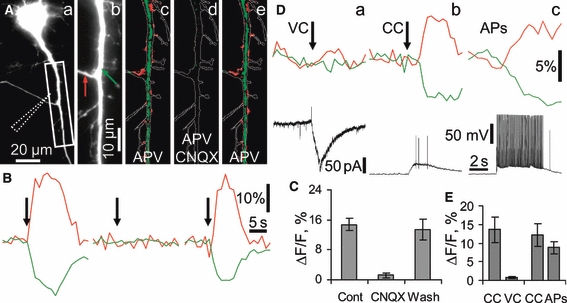
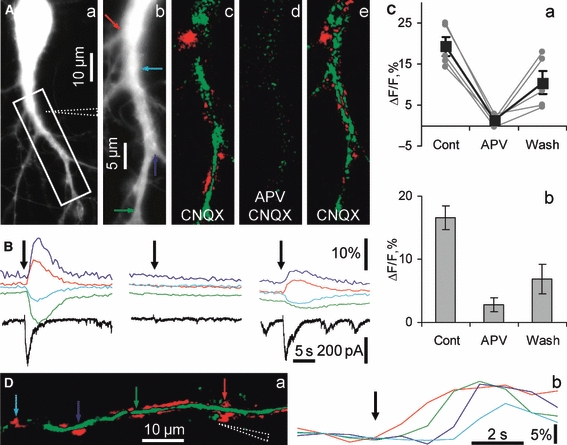
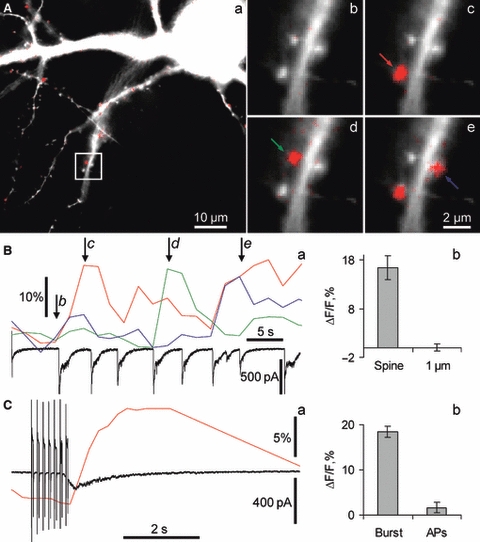
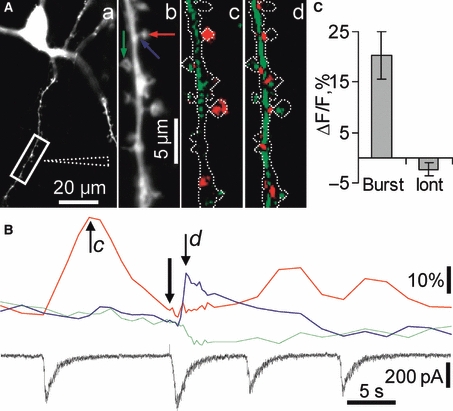
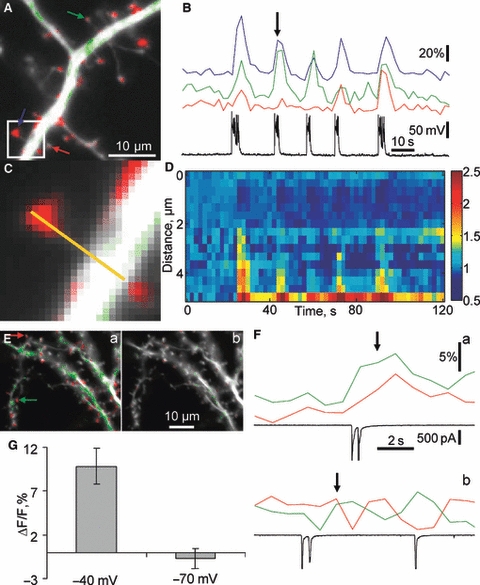
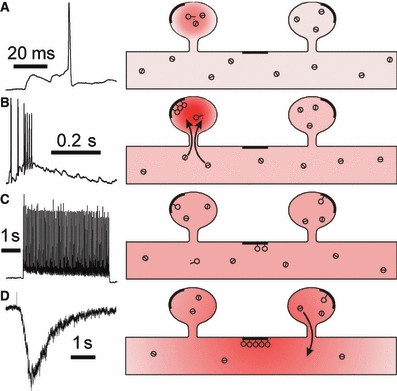
Hippocalcin is a Ca(2+)-binding protein that belongs to a family of neuronal Ca(2+)sensors and is a key mediator of many cellular functions including synaptic plasticity and learning. However, the molecular mechanisms involved in hippocalcin signalling remain illusive. Here we studied whether glutamate receptor activation induced by locally applied or synaptically released glutamate can be decoded by hippocalcin translocation. Local AMPA receptor activation resulted in fast hippocalcin-YFP translocation to specific sites within a dendritic tree mainly due to AMPA receptor-dependent depolarization and following Ca(2+)influx via voltage-operated calcium channels. Short local NMDA receptor activation induced fast hippocalcin-YFP translocation in a dendritic shaft at the application site due to direct Ca(2+)influx via NMDA receptor channels. Intrinsic network bursting produced hippocalcin-YFP translocation to a set of dendritic spines when they were subjected to several successive synaptic vesicle releases during a given burst whereas no translocation to spines was observed in response to a single synaptic vesicle release and to back-propagating action potentials. The translocation to spines required Ca(2+)influx via synaptic NMDA receptors in which Mg(2+) block is relieved by postsynaptic depolarization. This synaptic translocation was restricted to spine heads and even closely (within 1-2 microm) located spines on the same dendritic branch signalled independently. Thus, we conclude that hippocalcin may differentially decode various spatiotemporal patterns of glutamate receptor activation into site- and time-specific translocation to its targets. Hippocalcin also possesses an ability to produce local signalling at the single synaptic level providing a molecular mechanism for homosynaptic plasticity.


Figures

Fig. 1
Fig. 1
Local iontophoretic glutamate application induced hippocalcin-YFP translocation in cultured hippocampal neurons. (A) A set of images demonstrating glutamate-induced changes in hippocalcin-YFP fluorescence in an apical dendrite of an iontophoretically stimulated neuron. The fluorescent image (a) was taken using the YFP filter set. The position of the iontophoretic pipette is indicated by dashed lines. (Ab) A higher magnification image of a dendritic branch shown in the boxed area in Aa. Differential pseudocolour images were taken 2.5 s after the onset of short iontophoretic glutamate stimulation in control (c), in APV and CNQX (d), and after blocker washout (e). In this and other figures a green colour represents a decrease and red represents an increase in hippocalcin-YFP fluorescence. Colour arrows in b indicate sites where regions of interest (ROIs) were placed. Time courses of fluorescence changes in these ROIs in control, APV and CNQX, and after blocker washout are shown in B. Colours of traces match arrow colours in Ab. Onsets of iontophoretic glutamate applications are shown by black arrows. (C) Representative (taken from seven ‘red’ ROIs in the experiment shown in A) (a) and pooled (b) graphs showing a complete suppression of hippocalcin-YFP translocation by ionotropic glutamate receptor blockers.
Fig. 2
Fig. 2
AMPARs activation resulted in hippocalcin-YFP translocation due to Ca2+influx via voltage-gated calcium channels. Experiments were conducted in the constant presence of APV (40 μm) in order to block NMDARs. (A) A set of images demonstrating AMPAR-dependent hippocalcin-YFP translocation in a neuron stimulated by iontophoretically applied glutamate. A fluorescent image (a) was taken using the YFP filter set. The position of the iontophoretic pipette is indicated by dashed lines. (Ab) A higher magnification image of a dendritic branch shown in a boxed area in Aa. Differential pseudocolour images were taken at 3 s after onset of iontophoretic glutamate application (1.0 s, 100 nA) in control (c) and CNQX-containing (d) solutions, and after CNQX washout (e). A green colour represents a decrease and red represents an increase in hippocalcin-YFP fluorescence. An outline of the dendritic tree is shown in each pseudocolour image for better visualization of translocation sites. Colour arrows in Ab indicate sites where ROIs were placed. Time courses of fluorescence changes in these ROIs in control, CNQX (10 μm), and after the blocker washout are shown in B. Colours of traces match arrow colours in Ab. Onsets of iontophoretic glutamate applications are shown by black arrows. (C) Pooled results demonstrating complete suppression of hippocalcin-YFP translocation by CNQX. (D) Hippocalcin-YFP translocation induced by different stimulation protocols: voltage (a) [−70 mV, (VC)] and current (b) clamp (CC) combined with iontophoretic glutamate application (1.0 s, 100 nA); intracellular stimulation with 100 bpAPs at 20 Hz (APs) with no glutamate application conducted (c). A red trace represents an ROI with an increase of hippocalcin-YFP fluorescence whereas a green one represents an ROI with a fluorescence decrease; black traces represent changes in membrane currents (a) and potential (b, c), respectively. (E) Pooled results showing a suppression of hippocalcin-YFP translocations in VC mode and comparable translocations in CC and bpAPs.
Fig. 3
Fig. 3
Hippocalcin-YFP translocated due to direct Ca2+influx via NMDARs. (A) Images demonstrating NMDAR-dependent hippocalcin-YFP translocation in a neuron stimulated by iontophoretically applied glutamate in Mg2+-free solution in the presence of CNQX (10 μm), gabazine (5 μm) and glycine (10 μm). A fluorescent image (a) was taken using the YFP filter set. The position of the iontophoretic pipette is indicated by dashed lines. (Ab) A higher magnification image of a dendritic branch shown in the boxed area in Aa. Differential pseudocolour images were taken at 2.5 s after an onset of iontophoretic glutamate application (0.5 s, 100 nA) in control (c) and APV-containing (d) solutions, and after APV washout (e). A green colour represents a decrease and red represents an increase in hippocalcin-YFP fluorescence. Colour arrows in b indicate sites where ROIs were placed. Time courses of fluorescence changes in these ROIs in control, APV (40 μm) and after blocker washout are shown in B. Colours of traces match arrow colours in Ab. Onsets of iontophoretic glutamate applications are shown by black arrows in B. The currents (black traces) were recorded in voltage clamp mode at -60 mV to abolish Ca2+influx via VOCC and leave NMDARs as the only source of Ca2+influx. (C) Representative (taken from five ‘red’ ROIs in the experiment shown in A) (a) and pooled (b) graphs showing strong suppression of hippocalcin-YFP translocation by APV. (D) Hippocalcin-YFP translocation due to local activation of NMDARs and site-specific association of hippocalcin-YFP with the plasma membrane. A diffusional wave of glutamate released from a pipette (shown by dashed lines in a) during an iontophoretic pulse (200 ms, 100 nA; onset of application is indicated by a black arrow in b) initially induced hippocalcin-YFP translocation in a dendritic branch in a site proximal to the pipette (red arrow), after that in a more distal site indicated by a green arrow and finally in the most distal sites (blue and cyan arrows). Colour coding of traces in (b) matches the colours of arrows in (a). The distance from the pipette tip to the most distal ROI is about 50 μm and the glutamate wave passed this distance for about 3 s, in agreement with an estimated rate of glutamate diffusion in the extracellular solution. There was no translocation in more distal dendritic sites, indicating that glutamate did not reach NMDARs in these sites.
Fig. 4
Fig. 4
Strong activation of synaptic NMDARs induced hippocalcin-YFP translocation to dendritic spines. (A) An overlay of morphological (white) and hippocalcin-YFP translocation (red) images of neuron during a spontaneous burst of synaptic NMDAR-dependent currents at the time indicated as d in Ba. All synapses that were active during the burst appear in red. Panels b–e demonstrate overlays of morphological (white) and translocation images taken at the times indicated by respective letters in italic in Ba. Colour arrows indicate spines for which time courses of hippocalcin-YFP translocation are demonstrated in Ba. NMDAR-dependent currents were simultaneously recorded in whole-cell voltage clamp mode (holding potential −70 mV) and shown in Ba (black trace). (Bb) Values of hippocalcin-YFP translocation to spines compared with those in a dendritic tree at 1 μm from the respective spines. (C) Hippocalcin-YFP translocation to spines in response to membrane depolarization and to NMDAR-dependent synaptic current. An example of hippocalcin-YFP fluorescence changes and simultaneously recorded transmembrane current is shown in Ca. In this example, a spontaneous NMDAR-dependent postsynaptic current developed due to a network burst immediately after the train of depolarizing pulses (seven pulses from −70 to 0 mV; 50 ms at 7 Hz). It is clear that the current via synaptic NMDARs rather than the train induced hippocalcin-YFP translocation. In all neurons tested with this particular protocol no translocation was observed as a result of the trains. (Cb) Pooled results showing that a vigorous bpAP train (100 APs at 20 Hz) did not lead to hippocalcin-YFP translocation to sites where bursting-induced translocation was observed. At the same time, the trains did induce hippocalcin-YFP translocation to neighbouring sites in the dendritic shaft. ROIs were only placed over sites where bursting-induced hippocalcin-YFP translocation was observed. Experiments were conducted with CNQX, gabazine and glycine and without Mg2+.
Fig. 5
Fig. 5
Activation of synaptic and total pools of NMDARs resulted in differential hippocalcin-YFP signalling in spines. Spatial patterns of hippocalcin-YFP translocation induced by activation of synaptic and total (synaptic and extrasynaptic) pools of NMDARs. The synaptic pool was activated during spontaneous network bursts whereas the total pool was stimulated by iontophoretic glutamate application to a neuronal dendritic branch. (A) A fluorescent image (a) was taken using the YFP filter set. The position of the iontophoretic pipette is indicated by dashed lines. (Ab) A higher magnification image of a dendritic branch shown in the boxed area in Aa. Ac and Ad demonstrate translocation images taken at the times indicated by respective letters in italic in B. These differential pseudocolour images were taken after an onset of network burst (c) and of iontophoretic glutamate application (0.5 s, 100 nA) (d). An outline of the dendritic tree is shown in each pseudocolour image for better visualization of translocation sites. A green colour represents a decrease and red represents an increase in hippocalcin-YFP fluorescence. Colour arrows in Ab indicate sites where ROIs were placed. Time courses of fluorescence changes in these ROIs are shown in B. Colours of traces match arrow colours in Ab. An onset of iontophoretic glutamate application is shown by a black arrow in B. The postsynaptic current (black trace) was recorded in voltage clamp mode at −70 mV to abolish Ca2+influx via VOCC and leave NMDARs as the only source of Ca2+influx. (C) Pooled results demonstrating that hippocalcin-YFP translocates to dendritic spines during synaptic rather than both synaptic and extrasynaptic NMDAR activation. Experiments were conducted with CNQX, gabazine and glycine and without Mg2+in an extracellular solution in order to isolate NMDAR-dependent currents and to relieve them from Mg2+block.
Fig. 6
Fig. 6
Intrinsic bursts of network activity induced hippocalcin-YFP translocation to dendritic spines. (A) An overlay of hippocalcin-YFP fluorescent image and pseudocolour image demonstrating hippocalcin-YFP translocation sites at the moment indicated by a black arrow in B. A green colour represents a decrease and red represents an increase in hippocalcin-YFP fluorescence. Colour arrows in A indicate spines in which changes of fluorescence during bursting activity are demonstrated in B with the same colour coding. Changes in the neuronal membrane potential were simultaneously recorded and shown in B as a black trace. The translocation occurred in a normal extracellular solution (no glutamate receptor blockers and 1 mm Mg2+) with 1 μm of gabazine to decrease inhibition in order to induce bursting network activity. Not all spines showed an increase in hippocalcin-YFP fluorescence in response to a particular spontaneous network burst (compare red and green traces in B). A part of the dendritic tree indicated as a white square in A is shown in C at higher magnification. (D) Time course of hippocalcin-YFP fluorescent changes along a yellow line in C (distance ‘0’ represents a yellow line end opposite to a dendritic head). (E, F) Hippocalcin-YFP translocation to spines was due to direct Ca2+influx via NMDARs rather than due to other mechanisms related to the bursting network activity. Hippocalcin-YFP translocation induced by spontaneous bursting activity was recorded in a neuron voltage clamped at −40 mV (Ea, Fa) and −70 mV (Eb, Fb) in order to relieve and engage Mg2+block of NMDARs, respectively. (E) An overlay of morphological (white) and hippocalcin-YFP translocation images of a neuron taken at the time indicated by black arrows in F. Colour arrows in Ea indicate spines in which fluorescent changes during bursting activity are demonstrated in F with the same colour coding. Changes in the neuronal membrane current were simultaneously recorded and shown in F as black traces. (G) Comparison of hippocalcin-YFP translocation amplitudes in spines at −40 and −70 mV.
Fig. 7
Fig. 7
Hippocalcin translocation differentially decodes distinct patterns of [Ca2+]i changes induced by glutamate receptor activation. Schematic of [Ca2+]i changes and hippocalcin translocation in a part of the dendritic tree. The respective neuronal electrical activity is shown in the right part of the figure. Deeper hues of red show higher [Ca2+]i levels. Circles with a dash inside and outside denote free and Ca2+-bound forms of hippocalcin, respectively. Thicker lines show high-affinity plasma membrane sites. (A) Single subthreshold and threshold EPSPs induce [Ca2+]i transient limited to a specific spine with no visible hippocalcin translocation. (B) Several glutamate vesicles successively released in the same active synapse during the burst induce a larger and longer [Ca2+]i transient leading to robust hippocalcin translocation only to such spines. (C) A train of bpAPs cannot form the spatiotemporal pattern of [Ca2+]i necessary for hippocalcin translocation to the spines, rather resulting in lower and slower (compared with burst-induced spine translocation) hippocalcin accumulation in high-affinity (‘sticky’) plasma membrane sites of the dendritic tree. (D) Glutamate application induces local activation of synaptic and extrasynaptic NMDARs. The respective local Ca2+influx results in hippocalcin translocation to ‘sticky’ dendritic sites in this local dendritic area. A decreased cytosolic hippocalcin concentration in the dendritic tree prevents hippocalcin translocation to the spines in spite of synaptic NMDAR activation.

References

    1. Ames JB, Ishima R, Tanaka T, Gordon JI, Stryer L, Ikura M. Molecular mechanics of calcium-myristoyl switches. Nature. 1997;389:198–202. - PubMed
    1. Bardo S, Cavazzini MG, Emptage N. The role of the endoplasmic reticulum Ca2+store in the plasticity of central neurons. Trends Pharmacol. Sci. 2006;27:78–84. - PubMed
    1. Bayley P, Ahlstrom P, Martin SR, Forsen S. The kinetics of calcium binding to calmodulin: Quin 2 and ANS stopped-flow fluorescence studies. Biochem.Biophys.Res.Commun. 1984;120:185–191. - PubMed
    1. Ben Ari Y. Developing networks play a similar melody. Trends Neurosci. 2001;24:353–360. - PubMed
    1. Bezprozvanny I. The inositol 1,4,5-trisphosphate receptors. Cell Calcium. 2005;38:261–272. - PubMed

Publication types

MeSH terms

LinkOut - more resources