

Transcription profiling of fertilization and early seed development events in a solanaceous species using a 7.7 K cDNA microarray from Solanum chacoense ovules
- PMID: 20704744
- PMCID: PMC3095305
- DOI: 10.1186/1471-2229-10-174
Transcription profiling of fertilization and early seed development events in a solanaceous species using a 7.7 K cDNA microarray from Solanum chacoense ovules
Abstract
Background: To provide a broad analysis of gene expression changes in developing embryos from a solanaceous species, we produced amplicon-derived microarrays with 7741 ESTs isolated from Solanum chacoense ovules bearing embryos from all developmental stages. Our aims were to: 1) identify genes expressed in a tissue-specific and temporal-specific manner; 2) define clusters of genes showing similar patterns of spatial and temporal expression; and 3) identify stage-specific or transition-specific candidate genes for further functional genomic analyses.
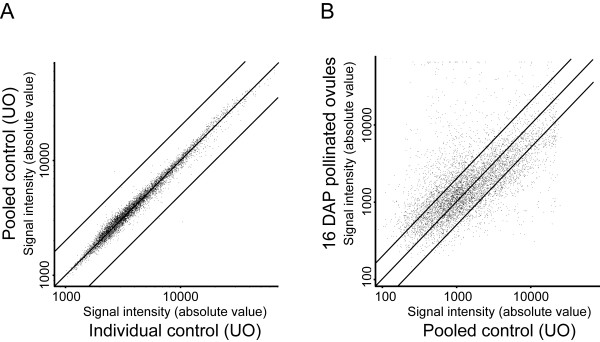
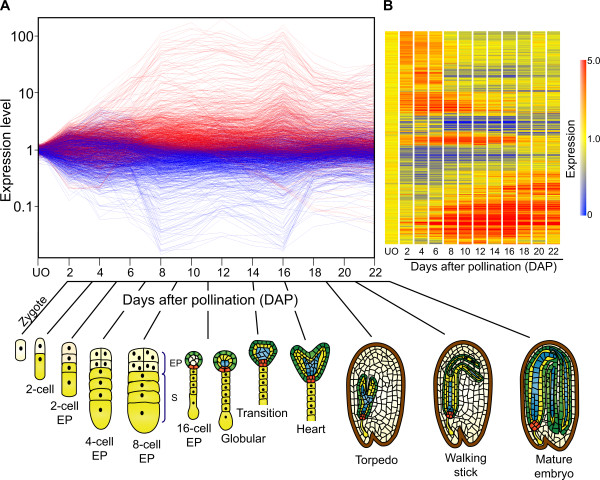
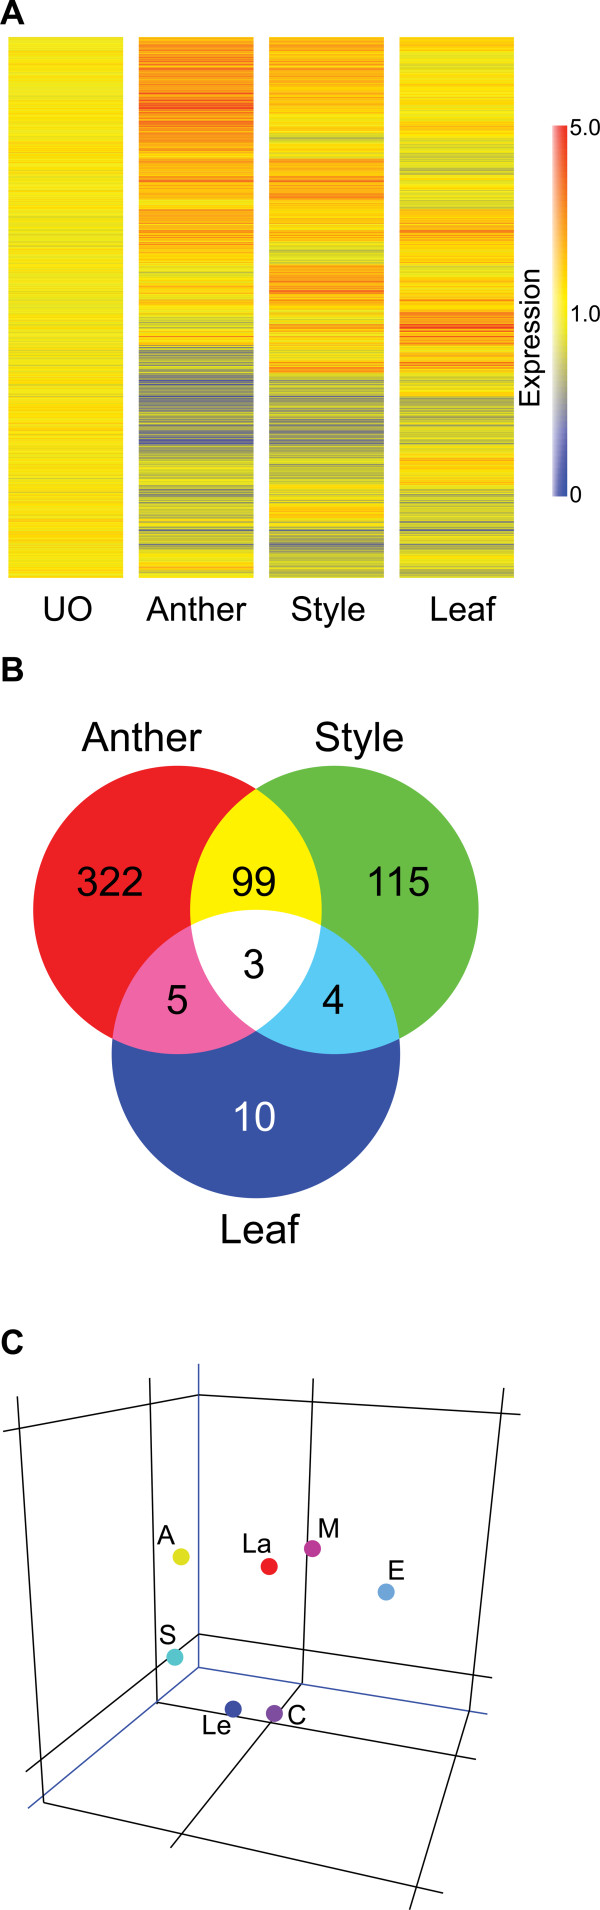
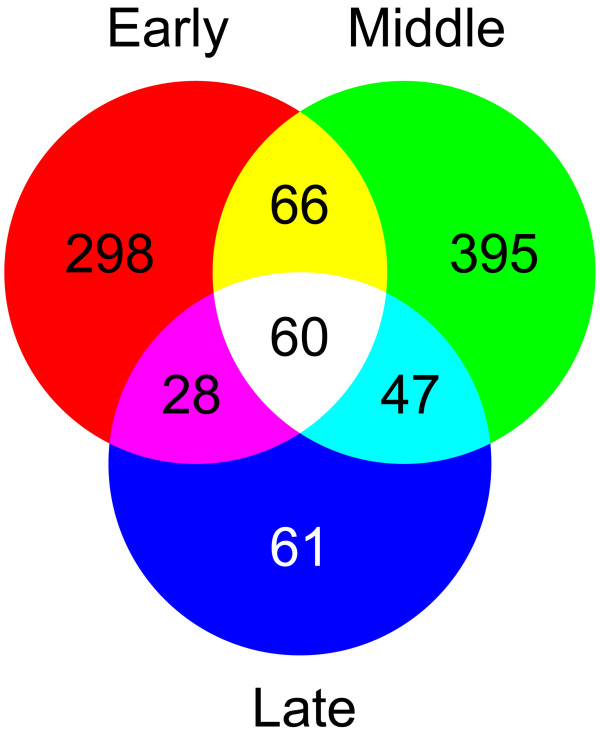
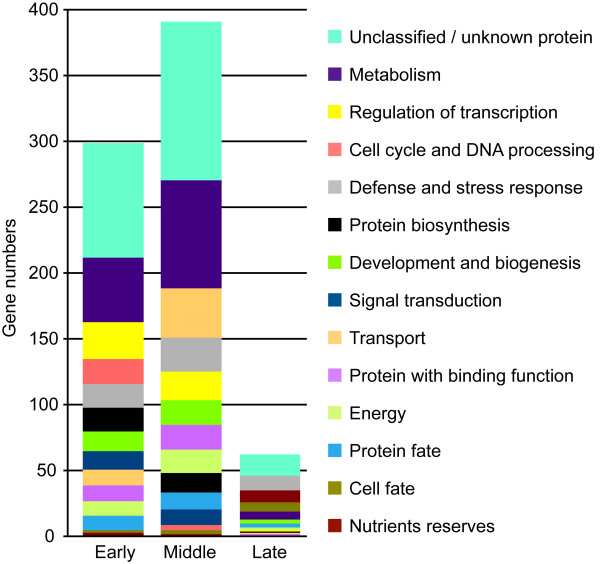
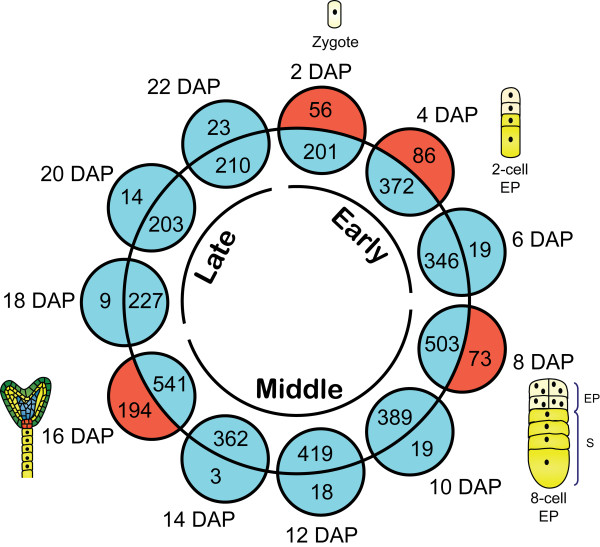
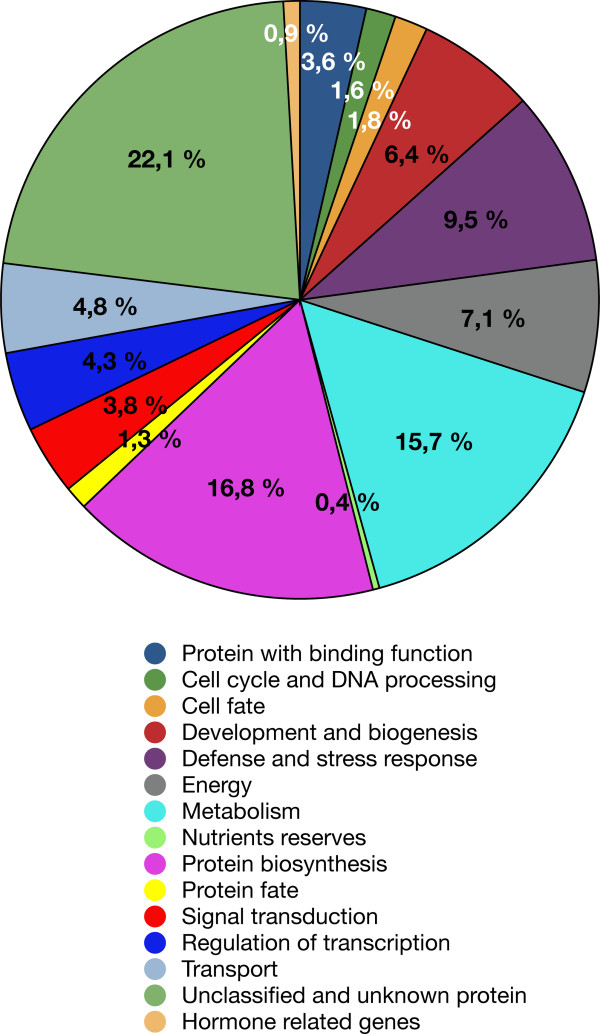
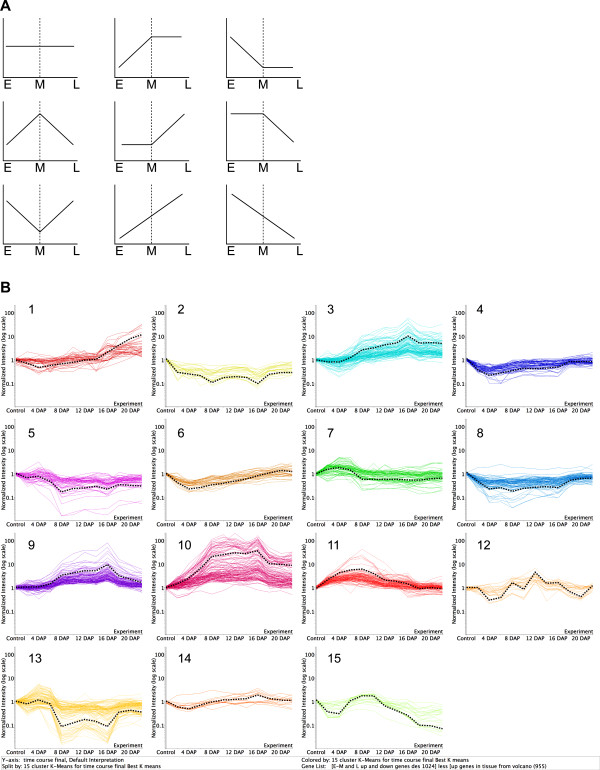
Results: We analyzed gene expression during S. chacoense embryogenesis in a series of experiments with probes derived from ovules isolated before and after fertilization (from 0 to 22 days after pollination), and from leaves, anthers, and styles. From the 6374 unigenes present in our array, 1024 genes were differentially expressed (>or= +/- 2 fold change, p value <or= 0.01) in fertilized ovules compared to unfertilized ovules and only limited expression overlap was observed between these genes and the genes expressed in the other tissues tested, with the vast majority of the fertilization-regulated genes specifically or predominantly expressed in ovules (955 genes). During embryogenesis three major expression profiles corresponding to early, middle and late stages of embryo development were identified. From the early and middle stages, a large number of genes corresponding to cell cycle, DNA processing, signal transduction, and transcriptional regulation were found. Defense and stress response-related genes were found in all stages of embryo development. Protein biosynthesis genes, genes coding for ribosomal proteins and other components of the translation machinery were highly expressed in embryos during the early stage. Genes for protein degradation were overrepresented later in the middle and late stages of embryo development. As expected, storage protein transcripts accumulated predominantly in the late stage of embryo development.
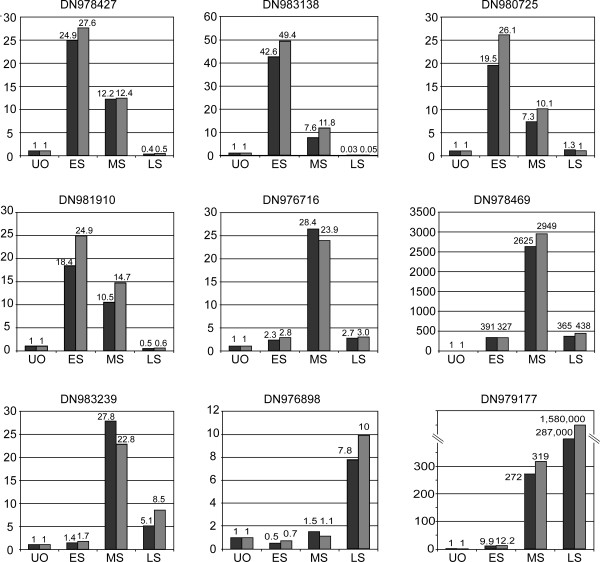
Conclusion: Our analysis provides the first study in a solanaceous species of the transcriptional program that takes place during the early phases of plant reproductive development, including all embryogenesis steps during a comprehensive time-course. Our comparative expression profiling strategy between fertilized and unfertilized ovules identified a subset of genes specifically or predominantly expressed in ovules while a closer analysis between each consecutive time point allowed the identification of a subset of stage-specific and transition-specific genes.
Figures
Similar articles
-
Loss of ovule identity induced by overexpression of the fertilization-related kinase 2 (ScFRK2), a MAPKKK from Solanum chacoense.J Exp Bot. 2006;57(15):4171-87. doi: 10.1093/jxb/erl194. Epub 2006 Nov 16. J Exp Bot. 2006. PMID: 17110585
-
A 6374 unigene set corresponding to low abundance transcripts expressed following fertilization in Solanum chacoense Bitt, and characterization of 30 receptor-like kinases.Plant Mol Biol. 2005 Oct;59(3):515-32. doi: 10.1007/s11103-005-0536-8. Plant Mol Biol. 2005. PMID: 16235114
-
Comparative De Novo Transcriptome Analysis of Fertilized Ovules in Xanthoceras sorbifolium Uncovered a Pool of Genes Expressed Specifically or Preferentially in the Selfed Ovule That Are Potentially Involved in Late-Acting Self-Incompatibility.PLoS One. 2015 Oct 20;10(10):e0140507. doi: 10.1371/journal.pone.0140507. eCollection 2015. PLoS One. 2015. PMID: 26485030 Free PMC article.
-
Role of ethylene in the regulatory mechanism underlying the abortion of ovules after fertilization in Xanthoceras sorbifolium.Plant Mol Biol. 2021 May;106(1-2):67-84. doi: 10.1007/s11103-021-01130-2. Epub 2021 Feb 21. Plant Mol Biol. 2021. PMID: 33611782
-
Oviposition strategies of conifer seed chalcids in relation to host phenology.Naturwissenschaften. 2004 Oct;91(10):472-80. doi: 10.1007/s00114-004-0554-4. Naturwissenschaften. 2004. PMID: 15729760 Review.
Cited by
-
Genome-wide analysis and expression profiling suggest diverse roles of GH3 genes during development and abiotic stress responses in legumes.Front Plant Sci. 2015 Jan 14;5:789. doi: 10.3389/fpls.2014.00789. eCollection 2014. Front Plant Sci. 2015. PMID: 25642236 Free PMC article.
-
Transcriptome analysis of ovules offers early developmental clues after fertilization in Cicer arietinum L.3 Biotech. 2023 Jun;13(6):177. doi: 10.1007/s13205-023-03599-8. Epub 2023 May 11. 3 Biotech. 2023. PMID: 37188294 Free PMC article.
-
The FRK1 mitogen-activated protein kinase kinase kinase (MAPKKK) from Solanum chacoense is involved in embryo sac and pollen development.J Exp Bot. 2015 Apr;66(7):1833-43. doi: 10.1093/jxb/eru524. Epub 2015 Jan 8. J Exp Bot. 2015. PMID: 25576576 Free PMC article.
-
Expression dynamics of metabolic and regulatory components across stages of panicle and seed development in indica rice.Funct Integr Genomics. 2012 Jun;12(2):229-48. doi: 10.1007/s10142-012-0274-3. Epub 2012 Mar 31. Funct Integr Genomics. 2012. PMID: 22466020
-
Pollination Type Recognition from a Distance by the Ovary Is Revealed Through a Global Transcriptomic Analysis.Plants (Basel). 2019 Jun 24;8(6):185. doi: 10.3390/plants8060185. Plants (Basel). 2019. PMID: 31238522 Free PMC article.
References
-
- Russell SD. Double fertilization. Int Rev Cytol. 1992;140:357–388. full_text.
-
- Russell SD. Attraction and transport of male gametes for fertilization. Sex Plant Reprod. 1996;9:337–342. doi: 10.1007/BF02441952. - DOI
-
- Guignard L. Sur les anthérozoïdes et la doube copulation sexuelle chez les végétaux angiospermes. C R Acad Sci Paris. 1899;128:864–871. - PubMed
-
- Nawaschin SG. Resultate einer Revision der Befruchtungsvorgänge bei Lilium Martagon und Fritillaria tenella. Bull Acad Sci St Petersburg. 1898;9:377–382.
Publication types
MeSH terms
LinkOut - more resources
Full Text Sources
Molecular Biology Databases
Research Materials
