. 2010 Aug 13;39(3):373-84.
doi: 10.1016/j.molcel.2010.07.011.

Smad proteins bind a conserved RNA sequence to promote microRNA maturation by Drosha

Affiliations

Smad proteins bind a conserved RNA sequence to promote microRNA maturation by Drosha

Brandi N Davis et al. Mol Cell. .

Abstract

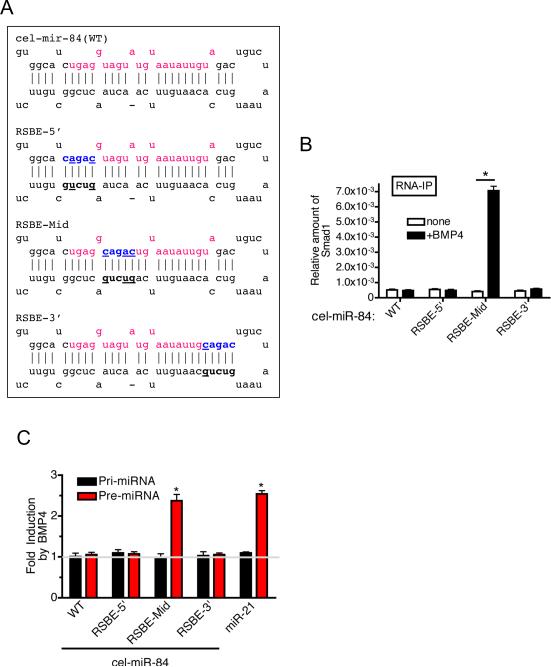
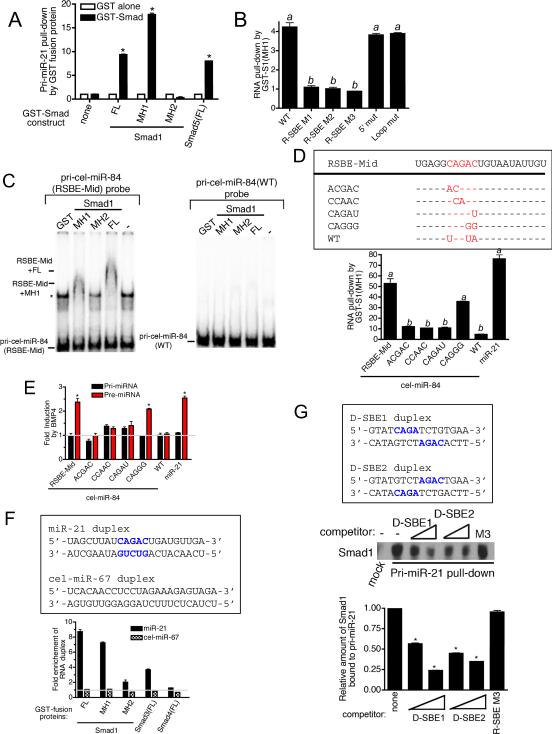
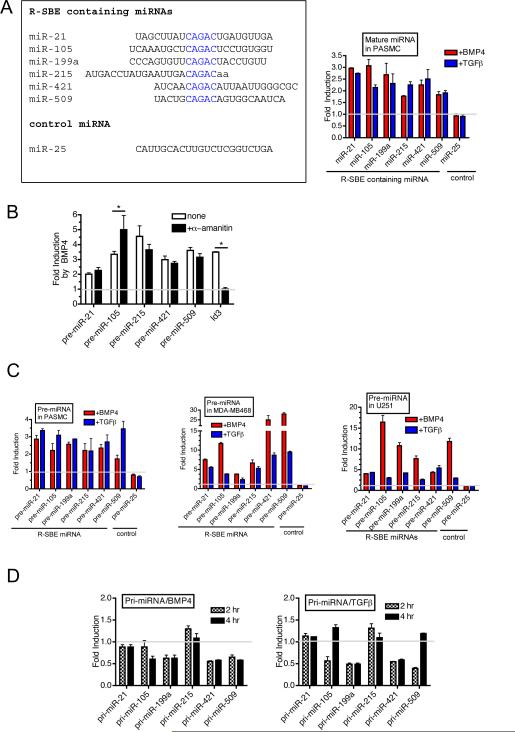
The signal transducers of the transforming growth factor beta (TGFbeta)/bone morphogenetic protein (BMP), the Smads, promote the expression of a subset of miRNAs by facilitating the cleavage reaction by Drosha. The mechanism that limits Smad-mediated processing to a selective group of miRNAs remained hitherto unexplored. In this study, we expand the number of TGFbeta/BMP-regulated miRNAs (T/B-miRs) to 20. Of interest, a majority of T/B-miRs contain a consensus sequence (R-SBE) within the stem region of the primary transcripts of T/B-miRs (pri-T/B-miRs). Here, we demonstrate that Smads directly bind the R-SBE. Mutation of the R-SBE abrogates TGFbeta/BMP-induced recruitment of Smads, Drosha, and DGCR8 to pri-T/B-miRs and impairs their processing, whereas introduction of R-SBE to unregulated pri-miRNAs is sufficient to recruit Smads and to allow regulation by TGFbeta/BMP. Thus, Smads are multifunctional proteins that modulate gene expression transcriptionally through DNA binding and posttranscriptionally through pri-miRNA binding and regulation of miRNA processing.


Figures

Fig.1
Fig.1. miRNA array analysis of TGFβ or BMP regulated miRNAs in PASMC
A. Unsupervised hierarchical clustering of the fold induction of microRNAs following 24H TGFβ or BMP4 treatment compared to mock treated PASMC was performed using Gene Pattern, and displayed as a heatmap where red corresponds to induction of mature miRNA by growth factor treatment and green corresponds to reduction relative to the mock treated control. B. Sequence logo representing the conserved motif present in miRNAs in Cluster 1 is indicated. The overall height of each stack indicates the sequence conservation at that position (measured in bits). The X-axis represents the relative location of the conserved nt along the mature miRNA, for clarity, only 5bp flanking the conserved CAGAC sequence are displayed.
Fig.2
Fig.2. The R-SBE sequence is essential for Smad-mediated regulation of Drosha processing
A. Schematic diagram of pre-miR-21 wild type and mutant sequences. Red and blue characters indicate the mature miRNA sequence and the R-SBE sequence found in pre-miR-21, respectively. Yellow highlighted characters indicate mutations introduced. B. Mouse C3H10T1/2 cells were transfected with human pri-miR-21 expression constructs, followed by treatment with or without 3 nM BMP4 for 2 hr and subjected to qRT-PCR analysis using primers to detect exogenous pri-miR-21 or pre-miR-21, normalized to GAPDH. Fold induction by BMP relative to mock treated cells is displayed. Induction of WT, 5' mut, and Loop mut by BMP4 is statistically significant. (*P<0.05, n=3) C. Cos7 cells were transfected with pri-miR-21 expression constructs along with Flag-Smad1, Flag-Drosha or Flag-DGCR8 expression constructs, and stimulated with BMP4 for 2 hr. RNA-IP assay using anti-Flag antibody was performed, followed by PCR amplification of exogenous pri-miR-21. Relative enrichment above a non-specific control IgG antibody IP control is shown. Expression of pri- or pre-miR-21 prior to IP was examined by qRT-PCR analysis using indicated primers, normalized to GAPDH (Input). (*P<0.05, n=3) Error bars represent s.e.m. See also supplemental Fig. S1.
Fig.3
Fig.3. Introduction of R-SBE is sufficient for the TGFβ-regulated processing of pri-miRNA
A. Schematic of pre-miRNA sequence of cel-miR-84 wild type and mutants. Red and blue characters indicate mature cel-miR-84 sequence and the location of the introduced R-SBE sequence, respectively. B. RNA-IP assay was performed in Cos7 cells transfected with Flag-Smad1 and different pri-cel-miR-84 constructs. Cells were treated with BMP4 for 2 hr followed by immunoprecipitaion of RNA fragments with anti-Flag antibody, and PCR amplification of pri-cel-miR-84. Fold enrichment of Flag IP relative to IgG control is presented (*P<0.01, n=3). C. Cos7 cells were transfected with pri-cel-miR-84 constructs or pri-miR-21 expression construct (positive control), followed by treatment with or without 3 nM BMP4 for 2 hr and subjected to qRT-PCR analysis using indicated primers, normalized to GAPDH. (*P<0.01, n=3). Error bars represent s.e.m. See also supplemental Fig. S2.
Fig.4
Fig.4. Direct association of Smad MH1 domain and the R-SBE
A. In vitro transcribed wild type pri-miR-21 was mixed with indicated recombinant, sepharose bead-immobilized GST-fusion proteins. Associated RNA was eluted, and subjected to qRT-PCR analysis to detect pri-miR-21. The relative amount of pri-miR-21 pulled down with GST-Smad fusion proteins, normalized to the amount pulled down with GST alone is presented (*P<0.01, n=3). B. In vitro transcribed pri-miR-21 constructs were mixed with recombinant GST-Smad1(MH1) or GST alone and the relative amount of pri-miR-21 transcripts pulled down with GST-Smad1(MH1) fusion protein was normalized to the amount pulled down with GST alone and presented. Values labeled with the same letter do not differ significantly from one another (P<0.05, n=3). C. EMSAs were performed with 1 nM of radiolabeled pri-cel-miR-84(RSBE-Mid) (left panel) or the wild type (WT) pri-cel-miR-84 (right panel) probe and recombinant GST-Smad1(FL, MH1 or MH2) proteins. Shifted bands as a result of specific binding to Smad1 are indicated. Asterisk indicates a non-specific band. Experiment was performed 3 times and a representative blot shown. D. Schematic diagram of mature miRNA sequence of wild type cel-miR-84, cel-miR-84 introduced with R-SBE (RSBE-Mid) and mutants (top panel). In vitro transcribed pri-cel-miR-84(RSBE-Mid), pri-miR-21 (positive controls), wild type cel-miR-84 (negative control) or R-SBE mutants were mixed with recombinant GST-Smad1(MH1) or GST alone and the relative amount of pri-miRNAs pulled down with GST-Smad1(MH1) fusion protein was normalized to the amount pulled down with GST alone and presented (bottom panel). Values labeled with the same letter do not differ significantly from one another (P<0.05, n=3). E. C3H10T1/2 cells were transfected with pri-cel-miR-84 constructs (WT or mutants) or pri-miR-21 expression construct (control), followed by treatment with or without 3 nM BMP4 for 2 hr and subjected to qRT-PCR analysis using indicated primers, normalized to GAPDH. (*P<0.01, n=3). F. Synthetic RNA duplexes (miR-21 or cel-miR-67) were mixed with recombinant GST alone or indicated GST-Smad fusion proteins. Fold enrichment of RNA duplex pulled down with GST-Smad fusion proteins over GST protein alone is presented. G. 3- or 30-fold molar excess of synthetic DNA duplex; SBE1 or SBE2, or 30-fold molar excess of in vitro transcribed pri-miR-21 R-SBE mutant 3 (R-SBE-M3) were added during Smad1 pull-down assay using in vitro transcribed pri-miR-21(WT) conjugated to agarose beads. The amount of Smad1 associated with pri-miR-21 in the presence of competitors was examined by immunoblot analysis with anti-Smad1 antibody (top panel). The relative amount of Smad1 bound to pri-miR-21 was quantitated by densitometry and presented (bottom panel). Error bars represent s.e.m. See also supplemental Fig. S3.
Fig.5
Fig.5. Identification of miRNAs regulated by the TGFβ signaling pathway post-transcriptionally
A. Sequence alignment of analyzed miRNAs containing R-SBE (left panel). Levels of expression of mature miRNAs, normalized to U6, were examined in PASMCs treated with 3nM BMP4 or 400pM TGFβ1 for 6 hr (right panel). miR-25 does not contain R-SBE and is not regulated by BMP4 or TGFβ1. Fold induction after treatment relative to mock treated PASMC is presented. B. PASMCs were pre-treated with RNA pol II inhibitor α-amanitin for 5 hr followed by treatment with or without 3 nM BMP4 for 2 hr and subjected to qRT-PCR analysis using primers to detect pre-miRNAs or Id3, normalized to GAPDH. Fold change relative to untreated cells is presented. (*P<0.05, compared to no treatment, n=3). C. Human PASMCs, MDA-MB-468 cells, or U251 cells were treated with 3 nM BMP4 or 400 pM TGFβ1 for 2 hr and subjected to qRT-PCR using indicated primers, normalized to GAPDH. The fold induction relative to mock treated sample is presented. D. Time-course expression of indicated pri-miRs, normalized to GAPDH, was examined by qRT-PCR in PASMCs stimulated with 3 nM BMP4 (left panel) or 400 pM TGFβ1 (right panel) for 2 or 4 hr. Fold induction compared to untreated samples are presented. Error bars represent s.e.m. See also supplemental Fig. 4 and supplemental table 5.
Fig.6
Fig.6. Smad is essential for recruitment of Drosha
A. RNA-IP assay was performed in PASMCs treated with BMP4 for 2 hr followed by immunoprecipitaion of RNA fragments with anti-Smad1/5 antibody, anti-Drosha antibody, or non-specific IgG (IgG), and PCR amplification was performed to detect indicated pri-miRNAs. Fold induction of binding relative to untreated PASMC is presented. Primers for miR-214 and -222 serve as negative controls as they are not regulated by TGFβ or BMP. A primer set recognizing the TMEM49 coding region (TM) was used as an additional negative control. (*P<0.001, n=3) B. PASMCs were transfected with non-targeting control siRNA (si-Control) or mixture of siRNAs for Smad1 and Smad5 (si-Smads). Twenty-four hr after transfection, cells were treated with 3 nM BMP4 for 2 hr, and subjected to RNA-IP analysis to examine recruitment of Drosha to indicated pri-miRNAs or TM using anti-Drosha antibody. The relative enrichment over IgG control IP is shown. qRT-PCR analysis of pri-miRNAs and pre-miRNAs, normalized to GAPDH, prior to immunoprecipitation is shown (input). As a control for R-smad knockdown, the level of Id3, normalized to GAPDH was monitored. (*P<0.001, n=3). Error bars represent s.e.m. See also supplemental Fig. S5.

Comment in

  • SMADs stimulate miRNA processing.
    Treiber T, Meister G. Treiber T, et al. Mol Cell. 2010 Aug 13;39(3):315-6. doi: 10.1016/j.molcel.2010.07.020. Mol Cell. 2010. PMID: 20705233

References

    1. Carthew RW, Sontheimer EJ. Origins and Mechanisms of miRNAs and siRNAs. Cell. 2009;136:642–655. - PMC - PubMed
    1. Cassiday LA, Maher LJ., 3rd Having it both ways: transcription factors that bind DNA and RNA. Nucleic Acids Res. 2002;30:4118–4126. - PMC - PubMed
    1. Davis BN, Hata A. Regulation of MicroRNA Biogenesis: A miRiad of mechanisms. Cell Commun Signal. 2009;7:18. - PMC - PubMed
    1. Davis BN, Hilyard AC, Lagna G, Hata A. SMAD proteins control DROSHAmediated microRNA maturation. Nature. 2008;454:56–61. - PMC - PubMed
    1. Dennler S, Itoh S, Vivien D, ten Dijke P, Huet S, Gauthier JM. Direct binding of Smad3 and Smad4 to critical TGFβ-inducible elements in the promoter of human plasminogen activator inhibitor-type1 gene. Embo J. 1998;17:3091–3100. - PMC - PubMed

Publication types

MeSH terms