. 2010 Aug 13;39(3):421-32.
doi: 10.1016/j.molcel.2010.07.022.

Phospholipase D2-dependent inhibition of the nuclear hormone receptor PPARgamma by cyclic phosphatidic acid

Affiliations

Phospholipase D2-dependent inhibition of the nuclear hormone receptor PPARgamma by cyclic phosphatidic acid

Tamotsu Tsukahara et al. Mol Cell. .

Abstract

Cyclic phosphatidic acid (1-acyl-2,3-cyclic-glycerophosphate, CPA), one of nature's simplest phospholipids, is found in cells from slime mold to humans and has a largely unknown function. We find here that CPA is generated in mammalian cells in a stimulus-coupled manner by phospholipase D2 (PLD2) and binds to and inhibits the nuclear hormone receptor PPARgamma with nanomolar affinity and high specificity through stabilizing its interaction with the corepressor SMRT. CPA production inhibits the PPARgamma target-gene transcription that normally drives adipocytic differentiation of 3T3-L1 cells, lipid accumulation in RAW264.7 cells and primary mouse macrophages, and arterial wall remodeling in a rat model in vivo. Inhibition of PLD2 by shRNA, a dominant-negative mutant, or a small molecule inhibitor blocks CPA production and relieves PPARgamma inhibition. We conclude that CPA is a second messenger and a physiological inhibitor of PPARgamma, revealing that PPARgamma is regulated by endogenous agonists as well as by antagonists.


Conflict of interest statement

Conflict of interest statement: GT is a founder of RxBio Inc.

Figures

Figure 1
Figure 1. CPA is an antagonist of PPARγ
(a) Structures of the lysophospholipids and ROSI. (b) CPA does not activate PPARγ-dependent PPRE-ACox-Luc expression. CV-1 cells were transfected with ACox-luc plus pcDNA3.1-PPARγ and treated for 20 h with 5 μM each of ROSI, LPA 18:1, AGP 18:1, CPA 18:1, MG, AG, or OA. Luciferase activities are presented as relative light units (RLU, mean ± SEM, n = 4, *p < 0.05, **p < 0.01). (c) Different molecular species of CPA and CGP dose-dependently suppress ROSI-induced PPARγ-dependent PPRE-TK-Luc reporter gene activation in B103 cells. B103 cells (3.0×10⁴) were transfected with pMH100-PPRE-TK-Luc, pCMX-PPARγ-Gal4, and pSV-β-gal. After transfection, the cells were exposed to CPA or CGP (0.1, 1 and 10 μM) with or without ROSI (10 μM) for 20h, and reporter gene expression measured (mean ± SEM, n=4). (d & e) Competitive displacement of 5 nM [3H]-ROSI or [32P]-AGP from PPARγ-LBD was determined using 2.5 μM cold ROSI, AGP, or CPA. (f) CPA 18:1 and CGP 18:1 displace [3H]-ROSI from purified LBD of PPARγ. Competition binding was performed using 5 nM [3H]-ROSI and increasing concentrations of CPA or CGP. (g) BODIPY-CPA competitively displaces [3H]-ROSI from PPARγ LBD. Competition biding assay was performed using purified 3 μg PPARγ-LBD with 5 nM [3H]-ROSI and increasing concentrations of either ROSI or BODIPY-CPA competitor. (h, i) Uptake of BODIPY-CPA (3 nmoles) into RAW264.7 macrophages. The rate of accumulation and the metabolic fate of labeled CPA was monitored in the medium (M or circles) and macrophages (C or squares) using TLC. The major fluorescent metabolite observed co-migrated with a standard for BODIPY-FA (fatty acid), indicating phospholipase/acyl transferase action. BODIPY-LPA was not detected. (j) BODIPY-CPA rapidly accumulated in the cell-associated pool and was present in the cytoplasm. Representative fluorescent microscopy image of 3 nmole BODIPY-CPA-treated RAW264.7 macrophages after 0.5 min and 30 min exposure (bar, 50 μm).
Figure 2
Figure 2. CPA inhibits PPARγ activation and is generated by PLD
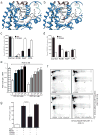
(a) Comparison of ROSI crystallized in PPARγ (1FM6) and CPA 18:1 docked into the inactive homology model of PPARγ. Blue ribbons show the backbone structure of the inactive PPARγ homology model. The inactive homology model differs from the active crystallographic structures only in the position of the AF-12 segment, which is shown as a green and a red ribbon in the inactive homology model and the crystallographic structure, respectively. Ligands are shown as ball and stick models. (b) Comparison of AGP 18:1 docked into the activated crystallographic structure of PPARγ (1FM9) and overlay of CPA 18:1 docked into the inactive homology model of PPARγ. Note that agonists ROSI and AGP occupy the same location and interact with residue R288, while CPA prevents the AF-12 domain from acquiring its activated conformation (red) by stabilizing the inactivated conformation (green). (c, d) Arginine 288 is required for inhibition of PPARγ by CPA. Purified WT and R288A mutant PPARγ (1 μg) were incubated with 5 nM [3H]-ROSI or [32P]-AGP 18:1 under equilibrium binding conditions with 2.5 μM cold ROSI, AGP, and CPA, and the bound ligand quantified using a filtration assay (mean ± SEM, n = 4). (e) ROSI-induced SMRT release from PPARγ is dose-dependently inhibited by both CPA 18:1 and CGP 18:1. CV-1 cells were transfected with UAS-Luc, pECE-Gal4-SMRT (containing full length SMRT), pVP16-PPARγ2, and pSV-β-gal. After transfection, the cells were treated with CPA 18:1 or CGP 18:1 for 30 min, followed by 1nM ROSI for 6 h. Luciferase activities are presented as fold increase (mean ± SEM, n=4, representative of 3 transfections). (f) Stimulation of biosynthetically [32P]-orthophosphate-labeled MDA-MB-231 cells with PMA (100 nM, 30 min) leads to CPA generation. PMA stimulation (100 nM) was also performed in the presence of either 1.5% 1-BuOH or t-BuOH. Phospholipids were separated using 2D-TLC and visualized using phosphorimaging. Arrows point to the position of the authentic CPA standard and asterisks indicate the position of the LPA standard. (g) CPA production in PMA-stimulated cells is inhibited by 1-BuOH but not by t-BuOH. Phosphorimaging-based quantification of labeled CPA after stimulation of MDA-MB-231 cells by 100 nM PMA in the presence or not of 1.5% v/v 1-BuOH and t-BuOH (mean cpm ± SEM, n = 4).
Figure 3
Figure 3. In vitro and in vivo generation of CPA by PLD2
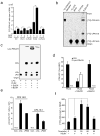
(a) PLD2 is the major source of CPA in vivo. CHO cells expressing tet-regulated WT or CI-PLD1 or PLD2 constructs were induced by DOX and subsequently stimulated with 100 nM PMA for 30 min. Cellular phospholipids were biosynthetically labeled with 0.1 mCi [32P]-Pi for 12 h, and CPA generation quantified using phosphorimaging after 2D-TLC separation (mean ± SEM, n = 3). (b) PLD2 generates CPA in vitro. Affinity-purified WT or CI-PLD2 (10 μg/reaction) was incubated with [14C]-LPC 16:0 at 40°C for 1 h. The reaction mixtures were spotted on a TLC plate and separated. Authentic cold CPA and LPA standards were used to determine the product Rfs. (c) 1-BuOH but not t-BuOH diverts recombinant PLD2 formation of CPA to lysophosphatidyl butanol (lyso-PtBuOH). TLC analysis of [14C]-phospholipids generated by purified PLD2 from Sf-9 insect cells after treatment with 0.5% 1-BuOH or t-BuOH. (d) Quantification of CPA and [14C]-lyso-PtBuOH formation by PLD2 in the presence of 0.5% 1-BuOH and t-BuOH (n = 3). N.D., not detectable. (e) LC-MS quantification of CPA 16:0 and 18:0 after stimulation of MDA-MB-231 cells by 100 nM insulin or PMA for 30 min (pmol mean ± SEM, n = 3). (f) Time course of insulin-stimulated CPA production in MDA-MB-231 cells. Cells (3×10⁶) biosynthetically labeled with [32P]-orthophosphate were exposed to 100 nM insulin for different times and the CPA purified using 2DTLC and quantified using liquid scintillation counting (n=3).
Figure 4
Figure 4. PLD2 activation inhibits PPARγ
(a) Insulin stimulation elevates CPA but not LPA levels. CV-1 cells (3×10⁶) were labeled with [32P]-orthophosphate for 6 h and stimulated with 100 nM insulin or the DMSO solvent for 30 min at 37°C. Lipids were extracted, separated by 2DTLC and quantified by phosphorimaging (n = 3). (b) CPA is generated in human peripheral blood mononuclear cells in response to PLD2 stimulation. The cells were pretreated with the PLD2 inhibitor FIPI (750 nM) or solvent control for 30 min prior to stimulation by 100 nM insulin, PMA 100 nM, 1 μg/ml LPS, or 1 mM H2O2. Data are representative of three other experiments with different donors. (c) Stimulation of PLD2 with insulin or mastoparan inhibits ROSI-induced PPARγ-reporter gene expression in a PLD-dependent manner. CV-1 cells were transfected with ACox–luc together with pcDNA3.1-PPARγ plasmid and treated for 20 h with 10 μM ROSI, 100 nM insulin, 20 μM mastoparan, and/or 1.5% 1-BuOH. Luciferase activities are presented as RLU (mean ± SEM, n = 4). (d) Insulin attenuates PPARγ activation. The ACox-luc reporter alone or in combination with the PPARγ plasmid was transfected into B103 cells and exposed to ROSI (5 μM) alone or with insulin. Reporter gene expression was measured 20h later (n = 5). (e) CI-PLD2 inhibits insulin-induced CPA production in CV-1 cells. Cells were either transduced with a CI-PLD2 or an empty adenovirus at MOI of 10. Phospholipids were biosynthetically labeled using [32P]-orthophosphate for 24 h post-transduction, and the cells stimulated with 100 nM insulin for 30 min. Phospholipids were separated using 2DTLC and visualized by phosphorimaging. Radioactivity incorporated into the CPA spot was scraped off and quantified by liquid scintillation counting (cpm mean ± SEM, n = 3, **p < 0.01). (f) CI-PLD2 acts as a dominant negative and abolishes insulin-induced inhibition of ROSI-induced PPARγ activation. CV-1 cells were either transduced with an adCI-PLD2 or an empty adenovirus. Subsequently, the transduced cells were transfected with the ACox-luc reporter gene and PPARγ plasmids for an additional 24 h. Cells were stimulated with 10 μM ROSI with or without 100 nM insulin for 20 h, and luciferase reporter expression determined (mean ± SEM, n=3, **p < 0.01).
Figure 5
Figure 5. CPA production by PLD2 inhibits PPARγ-mediated cellular responses
(a & b) PLD2 knockdown inhibits insulin- and PMA-induced CPA production in RAW264.7 and 3T3-L1 cells. 3 × 10⁶ RAW264.7 or NIH3T3 cells expressing scrambled shRNA or PLD2 shRNA were stimulated with 30 nM insulin or 100 nM PMA for 30 min prior to extraction of phospholipids for MS analysis (n=3). (c) B103 cells were transfected with the ACox-luc reporter gene alone or together with the PPARγ plasmid and exposed to ROSI (5 μM) with or without CPA (5 μM), AGP (5 μM) and insulin (1 nM) for 20 h, and reporter gene expression measured (mean ± SEM, n = 3). The inset shows PPARγ expression in WT B103 cells or cells transfected with the pcDNA3.1- PPARγ construct as determined by western blotting. (d) CPA inhibits foam cell formation and AC-LDL accumulation in the RAW264.7 mouse macrophage cell line. Cells were stimulated with combinations of 5 μM CPA and ROSI in the presence of 25 μg/ml AC-LDL for 24 h. Lipid accumulation was determined by ORO staining (bar = 50 μm). (e) CPA and the PPARγ antagonist GW9662 (5 μM each) inhibited ROSI- and AGP-induced (5 μM each) lipid accumulation in RAW264.7 macrophages. ORO accumulation was quantifed spectrophotometrically (mean ± SEM, n = 3). The inset shows PPARγ expression as assessed by western blotting and the lower panel shows β-actin as a loading control. (f) CPA inhibition of PPARγ target gene cd36 activation requires a PPRE element. CV-1 cells were transfected with PPARγ together with a cd36 reporter gene containing PPRE at position −273 in the promoter, or a truncated version at position −261 lacking the PPRE, and were treated for 20 h with 10 μM ROSI, AGP, or CPA. Luciferase activity was determined, and data are presented as RLU (mean ± SEM, n = 4).
Figure 6
Figure 6. CPA inhibits PPARγ-dependent transcriptional responses
(a) 3T3-L1 cells, which express both PPARγ1 and PPARγ2 protein (western blotting inset), were pretreated with 1 μM CPA, AGP or vehicle for 24 h and exposed to 100 nM ROSI. Quantitative RT-PCR (QT-PCR) for the adipocyte marker fabp4 was performed 5 days later. (b) CPA inhibits ROSI-induced lipid accumulation. 3T3-L1 cells pretreated with 1 μM CPA or vehicle for 24 h were induced to differentiate with ROSI (100 nM every other day) and stained with ORO after 10 days. Quantification of lipid accumulation was done spectrophotometrically (n=3). (c) Insulin or CPA inhibit lipid accumulation in 3T3-L1 cells. Cells were pretreated with 1 μM CPA or vehicle for 24 h and induced with 100 nM ROSI with or without 1 μM CPA or insulin and stained with ORO after 2 weeks. Quantification of lipid accumulation was done spectrophotometrically (n=3, **p=0.0002 for DMSO vs. ROSI, *p=0.0126 for ROSI vs. ROSI+0.03 nM insulin, **p=0.0010 for ROSI vs. ROSI + 0.3 nM insulin, *p=0.0494 for ROSI vs. ROSI+1 nM Insulin, and **p=0.0041 for ROSI vs. ROSI+CPA). (d, e) ROSI-induced gene expression of PPARγ target genes fabp4 and cd36 is inhibited by PLD2 in 3T3-L1 cells. 3T3-L1 cells expressing scrambled shRNA or PLD2 shRNA were pretreated with 30nM insulin or 10μM mastoparan for 30 min and cultured in ROSI (10 μM) or vehicle for 24 h. Total RNA was isolated and mRNA levels determined by QT-PCR (n=4). (f) Inhibition of ROSI-induced expression of PPARγ regulated genes by CPA in mouse peritoneal macrophages. Macrophages isolated from C57BL/6 mice were exposed to a 5 μM ROSI with or without 5 μM CPA or 1 μM GW9662 (positive control) for 12 h, and RNA was isolated. mRNA levels for the PPARγ upregulated (cd36, cyp27a1, hadh, capn3) and downregulated (csf1) gene targets were determined by QT-PCR) (n=3, representative experiment shown).
Figure 7
Figure 7. CPA and insulin prevent carotid wall remodeling
(a–b) Carotid arteries of anesthetized adult rats (5 per group) were exposed to 5 μM AGP alone (a) or with 5 μM CPA (b) for 1 h. (Masson trichrome staining, bar 200 μm). (c) CPA treatment blocks increase in intima-to-media ratios AGP-induced rat carotid arteries (n=5 per group). (d–f) Insulin (3 nM) was applied alone (d) or with 5 μM AGP (e) intralumenally for 1 h and neointima formation assessed three weeks alters. bar 200 μm. (f) Quantification of intima/media ratios (n=5).

References

    1. Bligh EG, Dyer WJ. A rapid method of total lipid extraction and purification. Can J Biochem Physiol. 1959;37:911–917. - PubMed
    1. Boullier A, Gillotte KL, Horkko S, Green SR, Friedman P, Dennis EA, Witztum JL, Steinberg D, Quehenberger O. The binding of oxidized low density lipoprotein to mouse CD36 is mediated in part by oxidized phospholipids that are associated with both the lipid and protein moieties of the lipoprotein. J Biol Chem. 2000;275:9163–9169. - PubMed
    1. Breen DM, Chan KK, Dhaliwall JK, Ward MR, Al Koudsi N, Lam L, De Souza M, Ghanim H, Dandona P, Stewart DJ, et al. Insulin increases reendothelialization and inhibits cell migration and neointimal growth after arterial injury. Arterioscler Thromb Vasc Biol. 2009;29:1060–1066. - PubMed
    1. Chakravarthy MV, Lodhi IJ, Yin L, Malapaka RR, Xu HE, Turk J, Semenkovich CF. Identification of a physiologically relevant endogenous ligand for PPARalpha in liver. Cell. 2009;138:476–488. - PMC - PubMed
    1. Cheng Y, Makarova N, Tsukahara R, Guo H, Shuyu E, Farrar P, Balazs L, Zhang C, Tigyi G. Lysophosphatidic acid-induced arterial wall remodeling: Requirement of PPARgamma but not LPA(1) or LPA(2) GPCR. Cell Signal 2009 - PMC - PubMed

Publication types

LinkOut - more resources