The expansion of T-cells and hematopoietic progenitors as a result of overexpression of the lymphoblastic leukemia gene, Lyl1 can support leukemia formation
- PMID: 20705338
- PMCID: PMC2980862
- DOI: 10.1016/j.leukres.2010.07.023
The expansion of T-cells and hematopoietic progenitors as a result of overexpression of the lymphoblastic leukemia gene, Lyl1 can support leukemia formation
Abstract
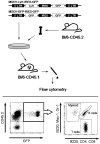
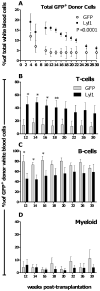
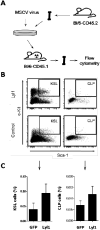
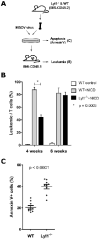
This study investigates the function of the lymphoblastic leukemia gene, Lyl1 in the hematopoietic system and its oncogenic potential in the development of leukemia. Overexpression of Lyl1 in mouse bone marrow cells caused T-cell increase in the peripheral blood and expansion of the hematopoietic progenitors in culture and in the bone marrow. These observations were the result of increased proliferation and suppressed apoptosis of the progenitor cells caused by the Lyl1-overexpression. Our studies present substantial evidence supporting the secondary, pro-leukemic effect of Lyl1 in early hematopoietic progenitors with the potential to cause expansion of malignant cells with a stem/early progenitor-like phenotype.
Copyright © 2010 Elsevier Ltd. All rights reserved.
Conflict of interest statement
The authors declare no financial conflict of interest.
Figures


Similar articles
-
E Protein Transcription Factors as Suppressors of T Lymphocyte Acute Lymphoblastic Leukemia.Front Immunol. 2022 Apr 20;13:885144. doi: 10.3389/fimmu.2022.885144. eCollection 2022. Front Immunol. 2022. PMID: 35514954 Free PMC article. Review.
-
Phenotypic alteration of bone marrow HSC and microenvironmental association in experimentally induced leukemia.Curr Stem Cell Res Ther. 2010 Dec;5(4):379-86. doi: 10.2174/157488810793351677. Curr Stem Cell Res Ther. 2010. PMID: 20528754
-
Hes1 mediates the different responses of hematopoietic stem and progenitor cells to T cell leukemic environment.Cell Cycle. 2013 Jan 15;12(2):322-31. doi: 10.4161/cc.23160. Epub 2012 Jan 15. Cell Cycle. 2013. PMID: 23255132 Free PMC article.
-
Genetic interaction between Kit and Scl.Blood. 2013 Aug 15;122(7):1150-61. doi: 10.1182/blood-2011-01-331819. Epub 2013 Jul 8. Blood. 2013. PMID: 23836559 Free PMC article.
-
Concise review: Blood relatives: formation and regulation of hematopoietic stem cells by the basic helix-loop-helix transcription factors stem cell leukemia and lymphoblastic leukemia-derived sequence 1.Stem Cells. 2012 Jun;30(6):1053-8. doi: 10.1002/stem.1093. Stem Cells. 2012. PMID: 22593015 Review.
Cited by
-
Decoding the genetic symphony: Profiling protein-coding and long noncoding RNA expression in T-acute lymphoblastic leukemia for clinical insights.PNAS Nexus. 2024 Jan 12;3(2):pgae011. doi: 10.1093/pnasnexus/pgae011. eCollection 2024 Feb. PNAS Nexus. 2024. PMID: 38328782 Free PMC article.
-
Prognostic Significance of the Lymphoblastic Leukemia-Derived Sequence 1 (LYL1) GeneExpression in Egyptian Patients with AcuteMyeloid Leukemia.Turk J Haematol. 2014 Jun;31(2):128-35. doi: 10.4274/tjh.2012.0063. Epub 2014 Jun 10. Turk J Haematol. 2014. PMID: 25035669 Free PMC article.
-
The transcription factor Lyl-1 regulates lymphoid specification and the maintenance of early T lineage progenitors.Nat Immunol. 2012 Jul 8;13(8):761-9. doi: 10.1038/ni.2365. Nat Immunol. 2012. PMID: 22772404 Free PMC article.
-
Comparing atmospheric and hypoxic cultured mesenchymal stem cell transcriptome: implication for stem cell therapies targeting intervertebral discs.J Transl Med. 2018 Aug 10;16(1):222. doi: 10.1186/s12967-018-1601-9. J Transl Med. 2018. PMID: 30097061 Free PMC article.
-
E Protein Transcription Factors as Suppressors of T Lymphocyte Acute Lymphoblastic Leukemia.Front Immunol. 2022 Apr 20;13:885144. doi: 10.3389/fimmu.2022.885144. eCollection 2022. Front Immunol. 2022. PMID: 35514954 Free PMC article. Review.
References
-
- Mellentin JD, Smith SD, Cleary ML. lyl-1, a novel gene altered by chromosomal translocation in T cell leukemia, codes for a protein with a helix-loop-helix DNA binding motif. Cell. 1989;58(1):77–83. - PubMed
-
- Green AR, Begley CG. SCL and related hemopoietic helix-loop-helix transcription factors. Int J Cell Cloning. 1992;10(5):269–76. - PubMed
-
- Capron C, et al. The SCL relative LYL-1 is required for fetal and adult hematopoietic stem cell function and B-cell differentiation. Blood. 2006;107(12):4678–86. - PubMed
-
- Baer R. TAL1, TAL2 and LYL1: a family of basic helix-loop-helix proteins implicated in T cell acute leukaemia. Semin Cancer Biol. 1993;4(6):341–7. - PubMed
Publication types
MeSH terms
Substances
Grants and funding
LinkOut - more resources
Full Text Sources
Medical
Miscellaneous

