. 2010 Aug 27;33(2):181-91.
doi: 10.1016/j.immuni.2010.07.017. Epub 2010 Aug 12.

The ubiquitin modifying enzyme A20 restricts B cell survival and prevents autoimmunity

Affiliations

The ubiquitin modifying enzyme A20 restricts B cell survival and prevents autoimmunity

Rita M Tavares et al. Immunity. .

Abstract

A20 is a ubiquitin modifying enzyme that restricts NF-kappaB signals and protects cells against tumor necrosis factor (TNF)-induced programmed cell death. Given recent data linking A20 (TNFAIP3) with human B cell lymphomas and systemic lupus erythematosus (SLE), we have generated mice bearing a floxed allele of Tnfaip3 to interrogate A20's roles in regulating B cell functions. A20-deficient B cells are hyperresponsive to multiple stimuli and display exaggerated NF-kappaB responses to CD40-induced signals. Mice expressing absent or hypomorphic amounts of A20 in B cells possess elevated numbers of germinal center B cells, autoantibodies, and glomerular immunoglobulin deposits. A20-deficient B cells are resistant to Fas-mediated cell death, probably due to increased expression of NF-kappaB-dependent antiapoptotic proteins such as Bcl-x. These findings show that A20 can restrict B cell survival, whereas A20 protects other cells from TNF-induced cell death. Our studies demonstrate how reduced A20 expression predisposes to autoimmunity.


Figures

Figure 1
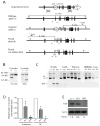
Figure 1. Gene targeting strategy to generate mice lacking tnfaip3 in B cells
(A) Schematic representation of the gene targeting construct and screening strategy for obtaining the tnfaip3 floxed (fl) allele. Half arrows indicate locations of PCR primers for distinguishing wild type (+), floxed (fl) and deleted (del) alleles. (B) Southern blots of BamHI digested genomic DNA from ES cells showing the targeted allele (left blot) and from tails from mice with germline inheritance of the fl allele (right blot). (C) Genomic DNA PCR analysis of wild type (+), floxed (fl) and deleted (del) alleles of tnfaip3 exon 2 in the indicated cell types from mice of the indicated genotypes using PCR primers shown in (A). BMDMs are bone marrow derived macrophages. All mice are CD19-Cre+/−. PCR products for floxed (fl), wild type (WT) and deleted (Del) alleles are indicated. Data are representative of 5 mice per genotype. (D) Quantitative genomic DNA PCR analysis of tnfaip3 exon 2 in flow cytometry-sorted populations of immature (CD19+ CD93[AA4.1]+) and GC (CD19+ GL7+ CD95+) B cells from mice of the indicated genotypes. PCR primers described in Methods. Error bars show S.E.M. of 3 mice per genotype. (E) Immunoblot analysis of A20 expression in B cells from the indicated genotypes of mice. The A20 to actin protein ratio relative to Tnfaip3+/+ CD19-Cre cells is shown below the blots.
Figure 2
Figure 2. Flow cytometric analyses of B lymphocyte populations in Tnfaip3fl/fl CD19-Cre mice
Flow cytometric analyses of lymphoid tissues. (A) Analyses of lymphoid populations in spleens and peripheral lymph nodes from 5 – 7 week-old mice. (B) Analysis of CD19+ gated cells showing B-cell maturation (IgM, IgD) from 5 – 7 week-old mice.. (C) Analysis of CD19+ gated cells showing GC B cells (GL7+ CD95+) from 5 – 7 week-old mice. (D) Plasma cells (CD19+ low CD138+) within TCRβ CD19+ gated splenic B cells from 6 month old mice are shown. Percentages of cells within the indicated gates are shown on plots. E) Histograms comparing expression of B cell activation markers (CD80, CD69, and CD95) on CD19+ gated cells from Tnfaip3+/+ cells (shaded histogram) Tnfaip3fl/+ cells (blue line) and Tnfaip3fl/fl B cells (red line). All data compare littermates of the indicated genotypes and are representative of 3–5 mice per genotype.
Figure 3
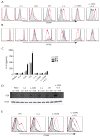
Figure 3. Hyper-responsiveness of A20-deficient B cells
In vitro responses of purified B cells after stimulation with the indicated stimuli for 72h. Flow cytometric analyses of (A) surface expression of the activation marker CD80 (B7.1) and (B) dilution of CFSE-labeled cells. Tnfaip3fl/fl CD19-Cre cells are shown in red lines; Tnfaip3fl/+ CD19-Cre cells shown in blue lines; and Tnfaip3+/+ CD19-Cre cells shown in shaded gray histograms. (C) ELISA determination of IL-6 secretion in the supernatants of 72 hr B cell cultures. Means and standard deviations of triplicate wells are shown. (D) Immunoblots of A20 and actin protein expression in purified Rosa-ER-Cre+ B cells of the indicated genotypes. Lysates were isolated after 72 hr stimulation with the indicated ligands in the presence of 4-OH-T. (E) Expression of CD80 in purified B cells after treatment with 4-OH-T and the indicated ligands for 72hr. Tnfaip3fl/fl GT-Rosa-Cre+ B cells treated with IL-4 or media (black lines) or the indicated ligands (red lines); Tnfaip3fl/+ GT-Rosa-Cre+ B cells treated with IL-4 or media (gray shaded histograms) or the indicated ligands (blue lines). All data are representative of 3 independent experiments.
Figure 4
Figure 4. A20 restricts NF-κB signaling downstream of CD40 signals
(A) Immunoblot analysis of A20 protein induction by agonist anti-CD40. (B) Immunoblot analyses of phospho-IκBα and IκBα after CD40 stimulation. Ratios of pIkBα/IkBα were normalized to time 0 of Tnfaip3+/+ CD19-Cre cells and are shown below. (C) Immunoblot analyses of NF-κB P-p100 (upper panel) and p100 (middle panel) protein amounts in response to agonist anti-CD40 antibody. Ratios of P-p100/actin, normalized to time 0 sample in Tnfaip3+/+ CD19-Cre B cells, are shown below P-p100 immunoblot. Ratios of p100/actin, normalized to time 0 sample in Tnfaip3+/+ CD19-Cre B cells, are shown below p100 immunoblot. (D) Immunoblot analysis of Erk signaling. Ratios of pErk/Erk were normalized to time 0 of Tnfaip3+/+ CD19-Cre cells and are shown below. Actin protein amounts shown below all panels as loading controls. Data are representative of 3 independent experiments.
Figure 5
Figure 5. Spontaneous autoantibody production in Tnfaip3fl/+ CD19-Cre and Tnfaip3fl/fl CD19-Cre mice
(A) Protein array analyses of autoantibodies in sera from 3 month old Tnfaip3fl/fl CD19-Cre (n=5), Tnfaip3fl/+ CD19-Cre (n=3), and Tnfaip3+/+ CD19-Cre (n=4) mice. Heat map shows relative reactivity to the respective antigens on the arrays, hierarchically clustered in both axes by Euclidean Distance. The reactivity intensities (MFI) are depicted on a relative color scale. Statistically different antigens were identified using 2-class Significant Analysis of Microarrays (SAM) with an unpaired t-test. (B) Antibody Forming Cells (AFC) measured on an Elispot for anti-dsDNA Ig producing B-cells. Counts were plotted as the mean of triplicate wells and S.D. is shown. Data are representative of 3 independent experiments. (C) Immunofluorescent analyses of glomerular Ig deposition in 6 month old mice of indicated genotypes. Analyses of IgM and IgG deposits shown in upper and middle panels, respectively. Data are representative of at 3 mice per genotype. Sections stained with hematoxylin and eosin are shown above. (D) Immunofluorescent analyses of glomerular deposition of Igs of the indicated isotypes after CpG treatment. 8–10 week old mice (n=4) of the indicated genotypes were treated with 40 μg of CpG intraperitoneally every other day for 2 weeks. Mice were analyzed 6 weeks after start of treatment. H&E sections shown above. All sections 100× magnification.
Figure 6
Figure 6. A20 deficient and hypomorphic B-cells are resistant to programmed cell death
(A) Flow cytometric analysis of CD95 (Fas) expression in enriched B cells after agonist anti-CD40 stimulation. Overlays of CD95 histograms on gated CD19+ cells from Tnfaip3+/+ CD19-Cre (shaded), Tnfaip3fl/+ CD19-Cre (dashed line), Tnfaip3fl/fl CD19-Cre (black line), and unstained control (dotted line) are shown. (B) Enriched B-cells stimulated for 48 hours with agonist anti-CD40 and treated with the indicated concentrations of agonist anti-CD95 for 12 hours were analyzed for survival by measuring the percentage of dead (Annexin-V+ DAPI+) cells by flow cytometry. Percent death was calculated as [% Fas induced dead - % control dead/100% - % control dead]. Data are plotted as mean ± S.D of triplicate wells. * indicates p < 0.001 using two way Anova. (C) Bcl-x mRNA amounts measured by real time quantitative (RT qPCR) in enriched B-cells. Cells of the indicated genotypes were stimulated with agonist anti-CD40 for the indicated times in the presence of an inhibitor or a control peptide, or left unstimulated. (D) Immunoblot analysis for the expression of Bcl-x protein in B-cells of the indicated genotypes stimulated with agonist anti-CD40 for the indicated times. Actin protein amounts are shown below as control. Ratios of Bcl-x to actin protein, normalized to the Tnfaip3+/+ B cells at time 0, are shown below each sample. All data are representative of 3 independent experiments.

Similar articles

Cited by

References

    1. Arvelo MB, Arvelo MB, Cooper JT, Longo C, Daniel S, Grey ST, Mahiou J, Czismadia E, Abu-Jawdeh G, Ferran C. A20 protects mice from D-galactosamine/lipopolysaccharide acute toxic lethal hepatitis. Hepatology. 2002;35:535–543. - PubMed
    1. Boone DL, Turer EE, Lee EG, Ahmad RC, Wheeler MT, Tsui C, Hurley P, Chien M, Chai S, Hitotsumatsu O, McNally E, Pickart C, Ma A. The ubiquitin-modifying enzyme A20 is required for termination of Toll-like receptor responses. Nat Immunol. 2004;5:1052–1060. - PubMed
    1. Cappione A, Anolik JH, Pugh-Bernard A, Barnard J, Dutcher P, Silverman G, Sanz I. Germinal center exclusion of autoreactive B cells is defective in human systemic lupus erythematosus. J Clin Invest. 2005;115:3205–3216. - PMC - PubMed
    1. Coornaert B, Baens M, Heyninck K, Bekaert T, Haegman M, Staal J, Sun L, Chen ZJ, Marynen P, Beyaert R. T cell antigen receptor stimulation induces MALT1 paracaspase-mediated cleavage of the NF-kappaB inhibitor A20. Nat Immunol. 2008;9:263–271. - PubMed
    1. Compagno M, Lim WK, Grunn A, Nandula SV, Brahmachary M, Shen Q, Bertoni F, Ponzoni M, Scandurra M, Califano A, et al. Mutations of multiple genes cause deregulation of NF-kappaB in diffuse large B-cell lymphoma. Nature. 2009;459:717–721. - PMC - PubMed

Publication types

MeSH terms

Substances