. 2010 Oct 22;285(43):33463-33474.
doi: 10.1074/jbc.M110.147033. Epub 2010 Aug 12.

Elucidation of a novel extracellular calcium-binding site on metabotropic glutamate receptor 1{alpha} (mGluR1{alpha}) that controls receptor activation

Affiliations

Elucidation of a novel extracellular calcium-binding site on metabotropic glutamate receptor 1{alpha} (mGluR1{alpha}) that controls receptor activation

Yusheng Jiang et al. J Biol Chem. .

Abstract

Metabotropic glutamate receptor 1α (mGluR1α) exerts important effects on numerous neurological processes. Although mGluR1α is known to respond to extracellular Ca(2+) ([Ca(2+)](o)) and the crystal structures of the extracellular domains (ECDs) of several mGluRs have been determined, the calcium-binding site(s) and structural determinants of Ca(2+)-modulated signaling in the Glu receptor family remain elusive. Here, we identify a novel Ca(2+)-binding site in the mGluR1α ECD using a recently developed computational algorithm. This predicted site (comprising Asp-318, Glu-325, and Asp-322 and the carboxylate side chain of the receptor agonist, Glu) is situated in the hinge region in the ECD of mGluR1α adjacent to the reported Glu-binding site, with Asp-318 involved in both Glu and calcium binding. Mutagenesis studies indicated that binding of Glu and Ca(2+) to their distinct but partially overlapping binding sites synergistically modulated mGluR1α activation of intracellular Ca(2+) ([Ca(2+)](i)) signaling. Mutating the Glu-binding site completely abolished Glu signaling while leaving its Ca(2+)-sensing capability largely intact. Mutating the predicted Ca(2+)-binding residues abolished or significantly reduced the sensitivity of mGluR1α not only to [Ca(2+)](o) and [Gd(3+)](o) but also, in some cases, to Glu. The dual activation of mGluR1α by [Ca(2+)](o) and Glu has important implications for the activation of other mGluR subtypes and related receptors. It also opens up new avenues for developing allosteric modulators of mGluR function that target specific human diseases.


Figures
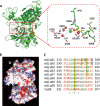
FIGURE 1.
FIGURE 1.
Predicted Ca2+-binding pocket in ECD of mGluR1α. A, location of the predicted Ca2+-binding site in the ECD (PDB entry code: 1EWK). The proposed key residues are indicated and highlighted in red (model generated by PyMOL). B, electrostatic potential map of ECD. The predicted Ca2+-binding site is in the hinge region and shares residue Asp-318 with the Glu-binding site. C, alignment of the grafted fragment in mGluRs and CaSR. Asp-318 is conserved in all of the receptors; Glu-325 is conserved in group I and II mGluRs; Asp-322 is conserved in group I mGluRs.
FIGURE 2.
FIGURE 2.
Metal binding properties of the grafted Ca2+-binding site. A, three-dimensional illustration of the modeled structure of the engineered protein CD2.D1, based on the crystal structures of CD2 (PDB entry code: 1HNG (35)) and the mGluR1α ECD (PDB entry code: 1EWT (8)). B, Tb3+ titration and Ca2+ competition (shown as inset) of CD2.D1. The engineered protein bound Tb3+ and Ca2+ with dissociation constants of 49 ± 9 μm and 1.8 ± 0.1 mm, respectively. Substitution of putative metal-binding ligand residues with Ile decreases Tb3+ binding affinity. Tb3+ binding curves of a series of CD2-mGluR1 double mutants, E331I/E333I, D324I/E325I, D318I/D322I, and E328I/N335I. All measurements were carried out in a buffer containing 20 mm PIPES and 10 mm KCl, pH 6.8. C, Tb3+ binding curves of a series of CD2-mGluR1 double mutants: CD2.D1-1 (E331I/E333I), CD2.D1-2 (D324I/E325I), CD2.D1-3 (D318I/D322I), and CD2.D1-4 (E328I/N335I). All of the measurements were carried out in a buffer containing 20 mm PIPES and 10 mm KCl, pH 6.8. D318I/D322I obviously decreased Tb3+ binding affinity, whereas D324I/E325I displays two phases. The Tb3+ binding affinity of the engineered protein was clearly impaired by these two pair of mutations (n = 3). D, La3+ binding to the engineered protein CD2.D1 monitored by 1D1H NMR. 1 or 2 mm La3+ results in the peak split at the aromatic group region. E, metal selectivity of CD2.D1. The addition of 500 mm K+, 1 mm Ca2+, 1 mm Mg2+, 100 μm Gd3+, or 100 μm La3+ to the pre-equilibrated Tb3+ (30 μm) and protein (3 μm) solution was carried out independently. The resultant changes in the Tb3+ luminescence signal were monitored at 545 nm (*, p < 0.05; **, p < 0.01).
FIGURE 3.
FIGURE 3.
Surface expression of WT mGluR1α and its mutants. mGluR1α carries FLAG tag at its N terminus and mCherry at its C terminus. mGluR1α and its mutants were transiently expressed in HEK293 cells seeded on 50-mm dishes coated with polylysine. After incubation with anti-FLAG, the receptors on the membrane could be visualized using a secondary antibody, Alexa 488-anti-mouse IgG (Invitrogen). Emissions at 520 and 610 nm were collected by flow cytometry (LSRFortessa, BD Biosciences); these represent receptors present on the cell membrane and overall, respectively. Ratios of fluorescence at 520–610 nm indicate the membrane expression levels of WT mGluR1α and its mutants. Emission at 520 nm (green signal) reflects the membrane expressed receptors, whereas the red signal at 610 nm from mCherry is a measure of total expression of the receptor. NT indicates non-transfected cells, which display no fluorescence. Although E325I displays a relatively lower surface expression, the other mutants have membrane expression level comparable with that of WT mGluR1α (n = 3).
FIGURE 4.
FIGURE 4.
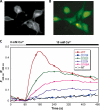
Intracellular Ca2+ response of WT mGluR1α and its mutants. WT mGluR1α and D318I-mGluR1α were overexpressed in HEK293 cells. Fura-2 was then loaded into the cells, and the [Ca2+]i level was measured by monitoring emission at 510 nm with excitation at 340 or 380 nm. A, red fluorescence of mCherry on the C terminus of mGluR1α indicates the presence of the receptor or its mutants. B, cells were loaded with Fura-2-AM to measure [Ca2+]i level. C, [Ca2+]i release triggered by [Ca2+]o in WT mGluR1α and its mutants. D318I and E325I eliminate the [Ca2+]i response, whereas D322I and S166A reduce it. NT, non-transfected cells.
FIGURE 5.
FIGURE 5.
Intracellular Ca2+ responses of WT mGluR1α and its mutants (D322I-mGluR1α, D324I-mGluR1α, E325I-mGluR1α, and E328I-mGluR1α) to [Ca2+]o in the presence of Glu. Shown are the additional Glu-enhanced responses of WT mGluR1α and all of its mutants to [Ca2+]o. The Glu concentrations that were added were determined by the responses of the wild type receptor or its mutants to Glu. That is, the Glu concentrations that evoked initial activation of or saturated the receptors were utilized for the [Ca2+]o-induced responses of the wild type receptor and its mutants. [Ca2+]i levels were measured by the same methods described above. Notably, E325I loses sensitivity to [Ca2+]o but can still sense [Glu]o. However, its responsiveness to [Ca2+]o in the presence of high concentration [Glu]o was not affected by increasing [Ca2+]o (n = 3).
FIGURE 6.
FIGURE 6.
Intracellular Ca2+ responses to extracellular Glu in HEK293 cells transfected with WT mGluR1α or its mutants. Three negatively charged residues in the predicted Ca2+-binding pocket (Asp-318, Asp-322, and Glu-325) were mutated into Ile. Along with WT mGluR1α, the mutants were transiently expressed in HEK293 cells. In the presence of 1.8 mm Ca2+, extracellular Glu-induced intracellular Ca2+ release was measured by recording emission intensities at 510 nm excited at 340 and 380 nm, respectively. A, responses to Glu of mutations on Ca2+-binding site. Except for mutant D318I, two other mutants, D322I, E325I, and WT mGluR1α display responsiveness to Glu. B, maximal response of WT mGluR1α and its mutants to Glu at a saturating concentration. Each single data point was performed in an individual dish, and the cells expressed mGluR1α showing responses to Glu were selected for analysis (n = 3).
FIGURE 7.
FIGURE 7.
Extracellular Ca2+ enhanced mGluR1α to sense extracellular Glu. Responses of WT mGluR1α to extracellular Glu were assessed in buffers containing additional [Ca2+]o (1.8, 5, and 10 mm). The maximal responses of the receptor to [Glu]o in 1.8, 5, and 10 mm [Ca2+]o are comparable, but the EC50 values for the responses in the presence of 5 and 10 mm [Ca2+]o are significantly decreased. Clearly, higher [Ca2+]o reduces the EC50 of the receptor for [Glu]o (n = 3).
FIGURE 8.
FIGURE 8.
Receptors with mutations in the Glu-binding pocket can sense Ca2+ but not Glu in physiological buffer. Four residues from the reported Glu-binding pocket were selected to mutate into non-polar residues. Intracellular Ca2+ levels indicated by Fura-2 were recorded using fluorescence microscopy, which detected the ratio of the emission at 510 nm with excitation at 340 and 380 nm. A, T188A and D208I abolish sensitivity to Glu, but S165A and Y236F still respond to 100 μm Glu. B, mutants S165A, T188A, D208I, and Y236F remain capable of responding to [Ca2+]o; the maximal responses of S165A, T188A, and D208I are comparable with that of WT mGluR1α, whereas Y236F decreases the sensitivity of the receptor to [Ca2+]o (n = 3).
FIGURE 9.
FIGURE 9.
Mutations D318I and E325I in the predicted Ca2+-binding site abolish [Ca2+]i responses of the receptor to [Gd3+]o. HEK293 cells expressing D318I, E325I, and WT mGluR1α were preincubated in 140 mm NaCl, 4 mm KOH, 10 mm HEPES, 1.5 mm Ca2+, 1 mm MgCl2, and 10 mm glucose, pH 7.5, for up to 1.5 h before fluorescence microscopy was carried out. Gd3+ was added into the loading buffer (140 mm NaCl, 4 mm KOH, 10 mm HEPES, and 0.3 MgCl2, pH 7.4) in the perfusion system. [Ca2+]i levels indicated by Fura-2 are presented by the ratio of the fluorescence at 510 nm when excited at 340 and 380 nm as above. The [Ca2+]i response of wild type mGluR1α displays a bell-shape curve, but D318I and E325I completely abolish [Ca2+]i release to [Gd3+]o (n = 3).
FIGURE 10.
FIGURE 10.
A dual activation model for mGluR1α involving both extracellular Ca2+ and Glu via the overlapping and interacting binding pockets for the two ligands at the hinge region of the ECD. Increasing either Glu or [Ca2+]o partially activates mGluR1α. However, full activation of intracellular Ca2+ signaling by mGluR1α requires the simultaneous binding of both Glu and Ca2+; Asp-318 plays a key role in the synergy between the two agonists. In this sense, mGluR1α can be viewed as a coincidence detector, requiring the binding of both ligands for maximal intracellular signaling.

Similar articles

Cited by

References

    1. Kano M., Kato M. (1987) Nature 325, 276–279 - PubMed
    1. Kaupmann K., Huggel K., Heid J., Flor P. J., Bischoff S., Mickel S. J., McMaster G., Angst C., Bittiger H., Froestl W., Bettler B. (1997) Nature 386, 239–246 - PubMed
    1. Nakanishi S. (1994) Neuron 13, 1031–1037 - PubMed
    1. Masu M., Tanabe Y., Tsuchida K., Shigemoto R., Nakanishi S. (1991) Nature 349, 760–765 - PubMed
    1. Conn P. J., Pin J. P. (1997) Annu. Rev. Pharmacol. Toxicol. 37, 205–237 - PubMed

Publication types