. 2010 Dec;156(Pt 12):3645-3659.
doi: 10.1099/mic.0.043851-0. Epub 2010 Aug 12.

Heterogeneous distribution of Candida albicans cell-surface antigens demonstrated with an Als1-specific monoclonal antibody

Affiliations

Heterogeneous distribution of Candida albicans cell-surface antigens demonstrated with an Als1-specific monoclonal antibody

David A Coleman et al. Microbiology (Reading). 2010 Dec.

Abstract

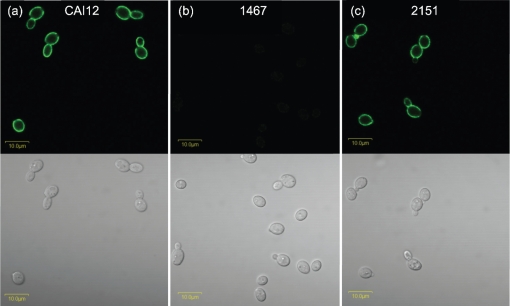
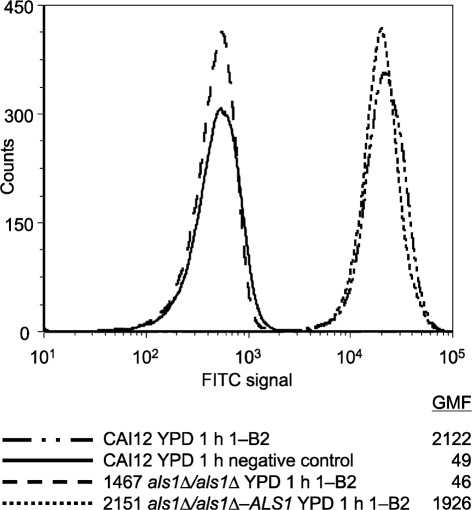
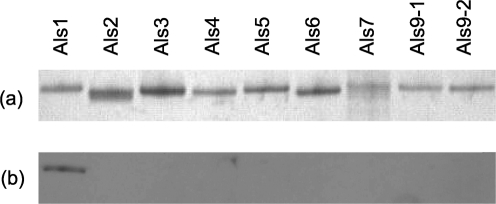
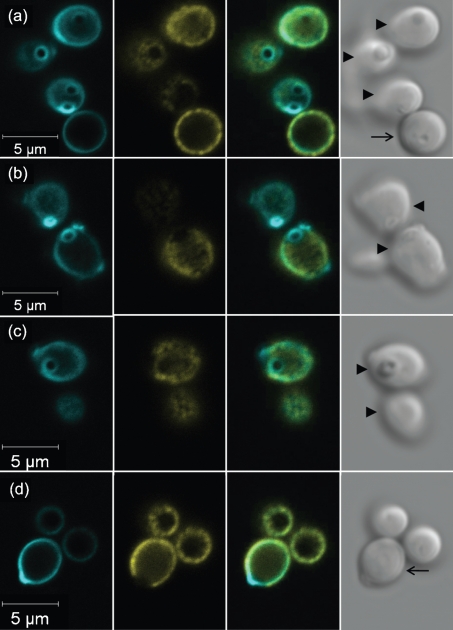
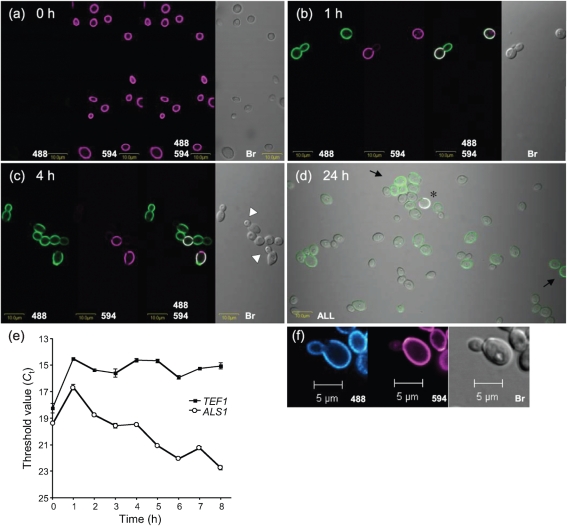
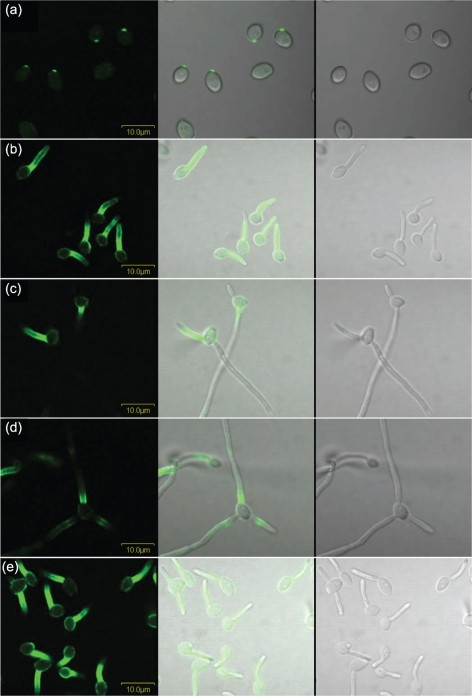
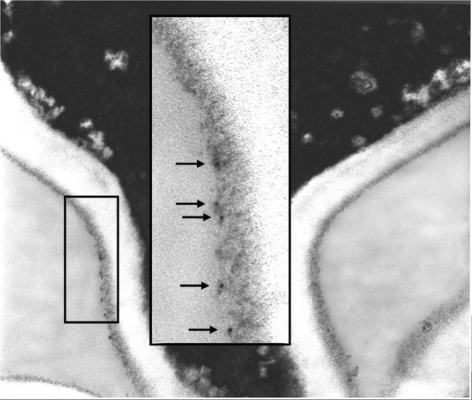
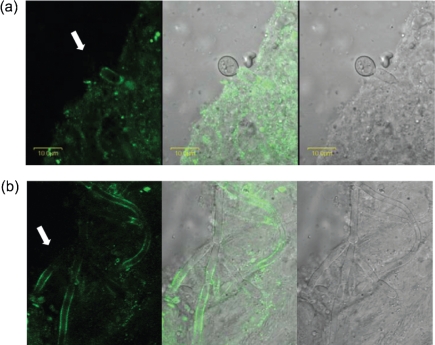
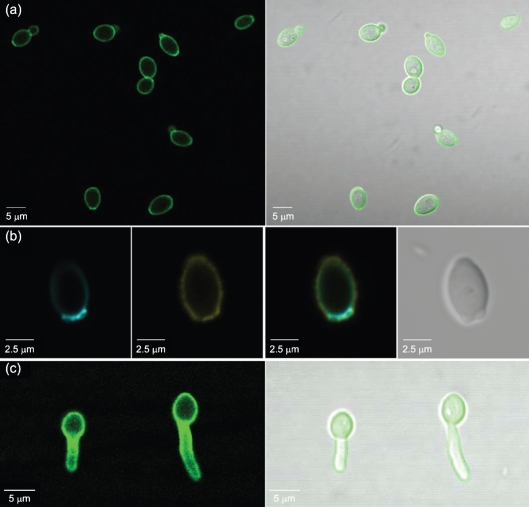
Despite an abundance of data describing expression of genes in the Candida albicans ALS (agglutinin-like sequence) gene family, little is known about the production of Als proteins on individual cells, their spatial localization or stability. Als proteins are most commonly discussed with respect to function in adhesion of C. albicans to host and abiotic surfaces. Development of a mAb specific for Als1, one of the eight large glycoproteins encoded by the ALS family, provided the opportunity to detect Als1 during growth of yeast and hyphae, both in vitro and in vivo, and to demonstrate the utility of the mAb in blocking C. albicans adhesion to host cells. Although most C. albicans yeast cells in a saturated culture are Als1-negative by indirect immunofluorescence, Als1 is detected on the surface of nearly all cells shortly after transfer into fresh growth medium. Als1 covers the yeast cell surface, with the exception of bud scars. Daughters of the inoculum cells, and sometimes granddaughters, also have detectable Als1, but Als1 is not detectable on cells from subsequent generations. On germ tubes and hyphae, most Als1 is localized proximal to the mother yeast. Once deposited on yeasts or hyphae, Als1 persists long after the culture has reached saturation. Growth stage-dependent production of Als1, coupled with its persistence on the cell surface, results in a heterogeneous population of cells within a C. albicans culture. Anti-Als1 immunolabelling patterns vary depending on the source of the C. albicans cells, with obvious differences between cells recovered from culture and those from a murine model of disseminated candidiasis. Results from this work highlight the temporal parallels for ALS1 expression and Als1 production in yeasts and germ tubes, the specialized spatial localization and persistence of Als1 on the C. albicans cell surface, and the differences in Als1 localization that occur in vitro and in vivo.


Figures

Fig. 1.
Fig. 1.
Immunolabelling of C. albicans yeasts with anti-Als1 mAb demonstrates cell-surface Als1 recognition and specificity of the mAb. Yeasts from saturated YPD cultures of C. albicans control strain CAI12 (a), 1467 (als1Δ/als1Δ) (b) and ALS1 reintegrant strain 2151 (als1Δ/als1Δ : : ALS1) (c) were transferred to fresh YPD medium for 1 h at 37 °C, immunolabelled with anti-Als1 and a FITC-conjugated secondary antibody, and viewed with an Olympus BX50 microscope. Upper panels with a dark background have laser illumination (488 nm); lower panels are illuminated with white light. Lack of Als1 on the mutant strain and detection of Als1 on the control and reintegrant strains supported the conclusion that the mAb recognized cell-surface Als1 and was specific for the protein. Bars, 10 μm.
Fig. 2.
Fig. 2.
Use of flow cytometry to demonstrate anti-Als1 specificity in populations of C. albicans yeast cells. C. albicans yeast cells of control strain CAI12, als1Δ/als1Δ mutant (1467) and ALS1 reintegrant (2151) strains were grown for 16 h in YPD and then transferred to fresh YPD for 1 h. Cells were immunolabelled with anti-Als1 and a FITC-conjugated secondary antibody. Geometric mean fluorescence (GMF) was measured as described previously (Coleman et al., 2009). The negative control sample was treated with the secondary antibody alone. An increased fluorescence intensity for strains that encoded ALS1 suggested that the mAb was specific for Als1.
Fig. 3.
Fig. 3.
Western blotting of the N-terminal domain from each protein in the Als family to demonstrate specificity of the anti-Als1 mAb. N-terminal fragments of each Als protein were produced in P. pastoris, as described previously (Coleman et al., 2009). Each fragment had a hexa-histidine tag at its C terminus and was purified by nickel-affinity chromatography. (a) Approximately 0.5 mg of each purified protein was run on an SDS-PAGE gel and silver-stained. (b) A second gel with identical lanes, and just 50 ng of each protein, was blotted to a Hybond-P PVDF membrane and Western-blotted with anti-Als1 at a concentration of 4.8 μg ml−1. Recognition of only the Als1 immunogen with the anti-Als1 mAb further supported the conclusion that the mAb was specific for Als1.
Fig. 4.
Fig. 4.
Anti-Als1 immunolabelling and Calcofluor White staining of C. albicans yeast cells to demonstrate the absence of Als1 localization to the bud scar. C. albicans strain CAI12 from a saturated culture was grown for 1 h in fresh YPD medium at 30 °C and fixed in paraformaldehyde. Fixed cells were immunolabelled with anti-Als1 and a FITC-conjugated secondary antibody. Cells were then stained with Calcofluor White, which binds to chitin, accentuating the fungal cell wall and bud scars. Cells were visualized with a Zeiss LSM 710 microscope. Rows (a–d) show images of Calcofluor-stained cells (left column, false coloured with cyan), FITC anti-Als1 labelling (second column from left, false coloured with yellow), a merged image (second column from right) and a bright-field image (right column). FITC labelling demonstrated Als1 on the cell surface with the exception of the bud scars, which were clearly stained with Calcofluor. Arrows within each bright-field image denote the plane of focus: an arrow with a tail shows cells with edges in focus, while arrowheads show cells where the cell surface was in focus so that the bud scar structure could be viewed more readily.
Fig. 5.
Fig. 5.
Photomicrographs of Alexa Fluor 594-labelled and anti-Als1-labelled C. albicans yeast cells to demonstrate decreasing cell-surface Als1 abundance on successive generations of yeast culture growth as well as stability of Als1 over time. Cells from a saturated YPD culture of strain CAI12 were transferred to fresh medium and grown at 30 °C for the indicated times [0 h, (a); 1 h, (b); 4 h, (c); 24 h, (d)]. In (a–c), replicate photomicrographs of the same image are shown illuminated with individual or combinations of wavelengths of light, as indicated. A Zeiss Axiovert 200M microscope was used to image cells. Anti-Als1 mAb was detected by a FITC-conjugated secondary antibody and 488 nm light (488). Alexa 594 covalently linked to the C. albicans cell surface was detected with 594 nm light (594). Bright-field microscopy was used to visualize all cells in a field (Br). Als1-negative buds are indicated by white arrowheads in (c). The photomicrograph in (d) was illuminated with all three light sources and shows many Als1-negative yeasts and a rare dual-labelled Als1/Alexa 594-positive cell (asterisk). Als1-positive cells in (d) are indicated by black arrows. Faint outlines of cells were the result of either autofluorescence (green) or bleeding of the FITC signal into the 594 channel (purple). Together, the images show that Als1-positive cells were rare in saturated cultures, that transfer of cells to fresh medium produced a coating of Als1, and that the protein coat persisted on the cell surface as the culture aged. (e) Real-time RT-PCR quantification of ALS1 transcriptional activity over the course of culture growth to demonstrate the burst in transcription that occurs following inoculation into fresh culture medium and the decreasing abundance of ALS1 RNA as culture growth progresses. Data from a representative biological replicate of the experiment are shown; triplicate data points were gathered for each time point. The threshold value (Ct) is graphed so that lower values indicate greater RNA abundance. (f) False-coloured image from a replicate time-course experiment viewed with a Zeiss LSM 710 NLO system. False colouring with a gradient of colour emphasizes the difference in anti-Als1 labelling intensity between the inoculum yeast (Alexa 594-positive, purple; Als1-positive, cyan gradient) and its daughter (Als1-positive, cyan gradient). Decreased anti-Als1 labelling intensity suggests that the transcriptional burst occurs in the inoculum cell and is diluted by cell division in each subsequent generation until anti-Als1 labelling intensity falls below the limit of detection for the assay.
Fig. 6.
Fig. 6.
Immunolabelling of C. albicans strain CAI12 with anti-Als1 over a time-course of germ tube growth. CAI12 cells were grown in YPD medium for 16 h at 37 °C, washed in DPBS, counted and transferred into pre-warmed RPMI medium at a cell density of 5×10⁶ cells ml−1. The culture was sampled at various time points and cells were fixed in paraformaldehyde, as described previously (Coleman et al., 2009). Fixed cells were immunolabelled with anti-Als1 and a FITC-conjugated secondary antibody. Cells were imaged using an Olympus BX50 FluoView microscope. Cell-surface Als1 was visible as early as 10 min following inoculation of the cells into RPMI (a). Anti-Als1 labelling of germ tubes was most intense in the region proximal to the mother yeast (b). While the longer germ tube/hypha was Als1-positive for most mother yeasts, exceptions were noted, including labelling of the shorter germ tube/hypha (c), or labelling of each germ tube/hypha (d). In each case, Als1 persisted on the germ tube/hypha over time. Growth of germ tubes in different culture conditions, such as Lee medium (e), resulted in the same general pattern of anti-Als1 labelling, with differences in the intensity of labelling of the mother yeast and/or germ tubes (other patterns not shown). Bars, 10 μm.
Fig. 7.
Fig. 7.
Electron micrograph of a C. albicans mother yeast–germ tube junction immunolabelled with anti-Als1 to show Als1 localization in the outer flocculant layer of the germ tube surface. Strain CAI12 germ tubes were grown in RPMI medium at 37 °C, immunolabelled with anti-Als1 mAb and a gold-conjugated secondary antibody, embedded and sectioned for electron microscopy. Arrows in the higher-magnification inset highlight gold particles.
Fig. 8.
Fig. 8.
Anti-Als1 immunolabelling of C. albicans recovered from murine kidney tissue shows similarities and differences with respect to immunolabelling of cultured cells. A BALB/cByJ mouse was inoculated via the lateral tail vein with 5×10⁵ cells of C. albicans strain CAI12. At 28 h post-inoculation, the kidneys were removed, minced with a razor blade, and then homogenized. A portion of the supernatant was treated with anti-Als1 mAb and an FITC-conjugated secondary antibody. Cells were imaged using an Olympus BX50 FluoView microscope. Images were illuminated with laser only (488 nm; left panel), white light (right panel) or both (centre panel). (a) Similar to cultured cells, hyphae were labelled with anti-Als1, but yeast cells were not (white arrow); however, yeast cells were difficult to find in the kidney tissues. (b) Although Als1-negative hypha segments were observed (white arrow), Als1 was detected on a much larger area of the surface of hyphae recovered from kidney tissue.
Fig. 9.
Fig. 9.
C. albicans yeast and germ tubes overexpressing ALS1 have a uniform cell-surface coat of Als1, even within bud scars. Strain 2243, which overexpressed ALS1 under the control of the constitutive, high-activity TPI1 promoter, was grown in YPD for 16 h at 30 °C and transferred to fresh culture medium. (a) Yeast cells from 8 h growth at 30 °C in fresh YPD medium were fixed in paraformaldehyde and immunolabelled with anti-Als1 and a FITC-conjugated secondary antibody. In contrast to the labelling pattern of the control C. albicans strain CAI12 (Fig. 1), yeast forms of the ALS1 overexpression strain were labelled strongly at the poles of the cell, suggesting Als1 localization within bud scars. This conclusion was strengthened by observation of overlapping fluorescent signals from anti-Als1 immunolabelling and Calcofluor White staining (b). From left, a Calcofluor-stained cell false coloured with cyan, FITC anti-Als1 labelling false coloured yellow, the merged image, and a bright-field image. (c) YPD-grown 16 h yeast cells of strain 2243 were inoculated into RPMI medium for 1 h to produce germ tubes. Strong anti-Als1 immunolabelling was observed over the surface of the mother yeast and the entire germ tube. All images were produced using a Zeiss LSM 710 microscope.

Similar articles

Cited by

References

    1. Banerjee, M., Thompson, D. S., Lazzell, A., Carlisle, P. L., Pierce, C., Monteagudo, C., López-Ribot, J. L. & Kadosh, D. (2008). UME6, a novel filament-specific regulator of Candida albicans hyphal extension and virulence. Mol Biol Cell 19, 1354–1365. - PMC - PubMed
    1. Bastidas, R. J., Heitman, J. & Cardenas, M. E. (2009). The protein kinase Tor1 regulates adhesin gene expression in Candida albicans. PLoS Pathog 5, e1000294. - PMC - PubMed
    1. Beucher, B., Marot-Leblond, A., Billaud-Nail, S., Oh, S.-H., Hoyer, L. L. & Robert, R. (2009). Recognition of Candida albicans Als3 by the germ tube-specific monoclonal antibody 3D9.3. FEMS Immunol Med Microbiol 55, 314–323. - PMC - PubMed
    1. Bi, E. (2001). Cytokinesis in budding yeast: the relationship between actomyosin ring function and septum formation. Cell Struct Funct 26, 529–537. - PubMed
    1. Braun, B. R. & Johnson, A. D. (2000). TUP1, CPH1 and EFG1 make independent contributions to filamentation in Candida albicans. Genetics 155, 57–67. - PMC - PubMed

Publication types

MeSH terms

LinkOut - more resources