. 2011 Jan 1;89(1):193-203.
doi: 10.1093/cvr/cvq249. Epub 2010 Aug 12.

G protein-coupled receptor kinase 2 and arrestin2 regulate arterial smooth muscle P2Y-purinoceptor signalling

Affiliations

G protein-coupled receptor kinase 2 and arrestin2 regulate arterial smooth muscle P2Y-purinoceptor signalling

Gavin E Morris et al. Cardiovasc Res. .

Abstract

Aims: prolonged P2Y-receptor signalling can cause vasoconstriction leading to hypertension, vascular smooth muscle hypertrophy, and hyperplasia. G protein-coupled receptor signalling is negatively regulated by G protein-coupled receptor kinases (GRKs) and arrestin proteins, preventing prolonged or inappropriate signalling. This study investigates whether GRKs and arrestins regulate uridine 5'-triphosphate (UTP)-stimulated contractile signalling in adult Wistar rat mesenteric arterial smooth muscle cells (MSMCs).

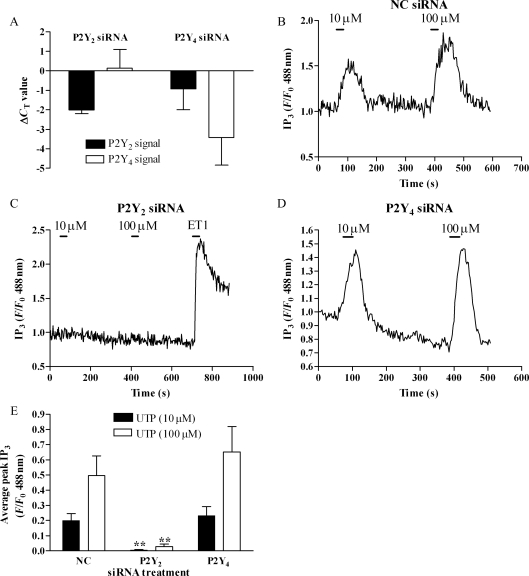
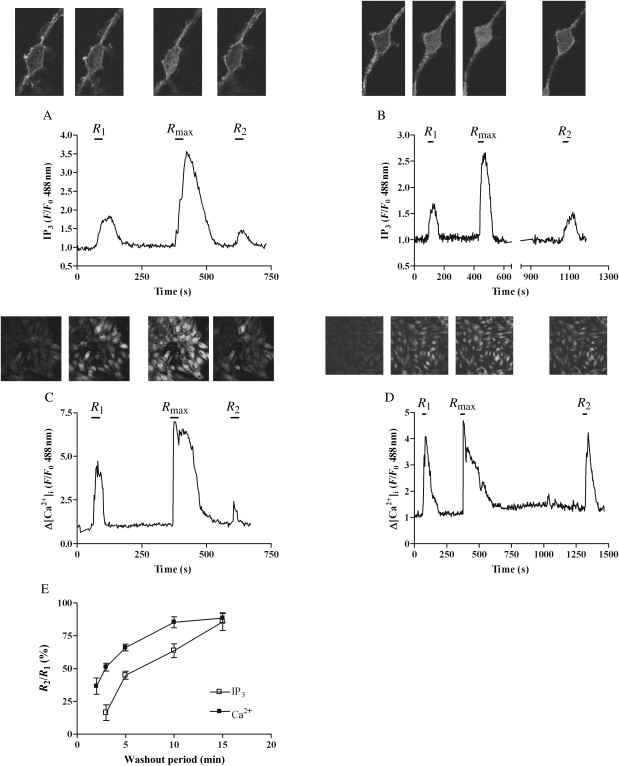
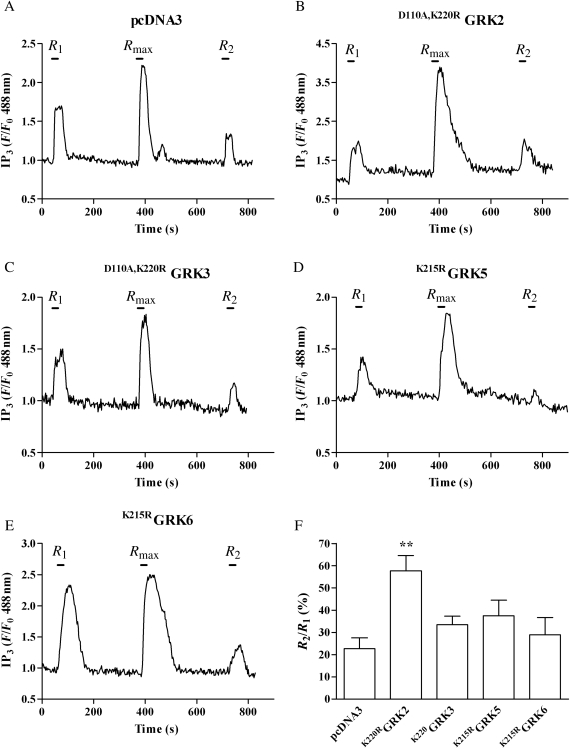
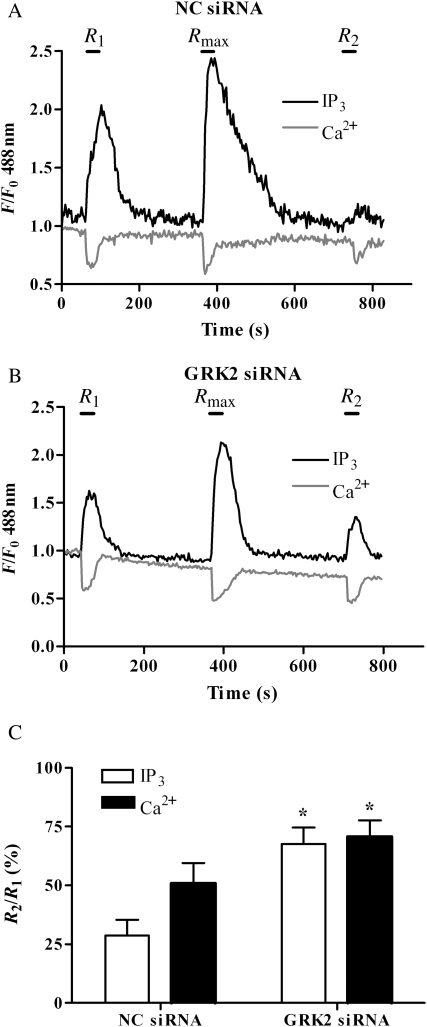
Methods and results: mesenteric arteries contracted in response to UTP challenge: When an EC(50) UTP concentration (30 µM, 5 min) was added 5 min before (R(1)) and after (R(2)) the addition of a maximal UTP concentration (R(max): 100 µM, 5 min), R(2) responses were decreased relative to R(1), indicating desensitization. UTP-induced P2Y-receptor desensitization of phospholipase C signalling was studied in isolated MSMCs transfected with an inositol 1,4,5-trisphosphate biosensor and/or loaded with Ca(2+)-sensitive dyes. A similar protocol (R(1)/R(2) = 10 µM; R(max) = 100 µM, applied for 30 s) revealed markedly reduced R(2) when compared with R(1) responses. MSMCs were transfected with dominant-negative GRKs or siRNAs targeting specific GRK/arrestins to probe their respective roles in P2Y-receptor desensitization. GRK2 inhibition, but not GRK3, GRK5, or GRK6, attenuated P2Y-receptor desensitization. siRNA-mediated knockdown of arrestin2 attenuated UTP-stimulated P2Y-receptor desensitization, whereas arrestin3 depletion did not. Specific siRNA knockdown of the P2Y(2)-receptor almost completely abolished UTP-stimulated IP(3)/Ca(2+) signalling, strongly suggesting that our study is specifically characterizing this purinoceptor subtype.

Conclusion: these new data highlight roles of GRK2 and arrestin2 as important regulators of UTP-stimulated P2Y(2)-receptor responsiveness in resistance arteries, emphasizing their potential importance in regulating vasoconstrictor signalling pathways implicated in vascular disease.


Figures

Figure 1
Figure 1
Characterization of UTP-stimulated contractions of third-order mesenteric arteries. (A) Representative trace showing K+-induced contraction followed by washout and concentration-dependent UTP (0–100 µM)-stimulated contractions (B) Cumulative concentration-dependent UTP-stimulated arterial contraction data shown as means ± SEM for arterial preparations from at least four animals. (CE) Desensitization protocol: arteries were exposed to 30 µM UTP (R1, for 1 min) challenge, followed by 5 min washout, maximal UTP (Rmax = 100 µM, 1 min) challenge, followed by a variable period of 2–15 min washout before a further 30 µM UTP (R2, 1 min) exposure. Representative traces from single arteries with either a 5 min (C) or 15 min (D) Rmax-to-R2 washout period are shown. (E) Time-course of resensitization of the contractile response to UTP expressed as a percent change in R2 relative to R1 (means ± SEM for arterial preparations from at least four animals).
Figure 2
Figure 2
Dissecting the P2Y2/P2Y4-receptor dependency of UTP signalling. (A) Real-time PCR data showing changes in cycle threshold (ΔCT) values for P2Y2 or P2Y4 transcripts, relative to negative-control (NC) and untransfected cells, following transfection with 100 nM of anti-P2Y2 or anti-P2Y4 receptor siRNAs. Data shown are means ± SEM for n = 6 experiments (in triplicate) undertaken in cell preparations from six separate animals. Representative traces (BD) and cumulative data (E) showing affects of NC (B), anti-P2Y2 (C), or anti-P2Y4 (D) siRNAs on UTP-stimulated (10 or 100 µM) IP3 signals. Data expressed as means ± SEM for n = 8–10 cells from cell preparations produced from four or more separate animals. Statistical significance is indicated as asterisk **P < 0.01 vs. NC siRNA (one-way ANOVA, Dunnett's post hoc test).
Figure 3
Figure 3
Time-course of UTP-induced P2Y2-receptor desensitization. MSMCs were transfected with eGFP-PH (0.5 µg), or loaded with Fluo4 and subjected to the following desensitization protocol: cells were challenged with UTP (R1, 10 µM, 30 s) 5 min before a desensitizing UTP concentration (Rmax = 100 µM for 30 s), and again after a variable washout period (2, 3, 5, 10, or 15 min) (R2, 10 µM, 30 s). Representative traces and images from single cells either expressing eGFP-PH (A and B) or loaded with Fluo4 (C and D) with either a 3 (A and C), 10 (B), or 15 min (D) wash period are shown. P2Y2 receptor desensitization was determined as the relative (%) change in R2 response compared with R1 for both eGFP-PH and Fluo4 signals. (E) Cumulative data are presented as means ± SEM for five to nine cells (eGFP-PH), or 21–45 cells (Fluo4) at each time-point. MSMCs used were generated from preparations from three or more different animals.
Figure 4
Figure 4
GRK2 inhibition decreases P2Y2-receptor desensitization induced by UTP. MSMCs were co-transfected with 0.5 µg eGFP-PH and either pcDNA3 (control), D110A,K220RGRK2, D110A,K220RGRK3, K215RGRK5, or K215RGRK6 (0.5 µg). Cells were subjected to the standard R1/Rmax/R2 protocol (see Section 2). Representative traces show IP3 changes in cells transfected with pcDNA3 (A), D110A,K220RGRK2 (B), D110A,K220RGRK3 (C), K215RGRK5 (D), or K215RGRK6 (E). P2Y receptor desensitization was determined as the relative (%) change in R2 response compared with R1. (F) Cumulative data are presented as means ± SEM from 13–19 cells from MSMC preparations from four or more different animals. Statistical significance is indicated as asterisk **P < 0.01 vs. vector-transfected MSMCs (one-way ANOVA; Dunnett's post hoc test).
Figure 5
Figure 5
Depletion of endogenous GRK2 attenuates P2Y2-receptor desensitization. MSMCs were nucleofected with 0.5 µg eGFP-PH and either negative-control (NC) or anti-GRK2 (10 nM) siRNAs. Cells were loaded with Fura-Red and subjected to the standard R1/Rmax/R2 desensitization protocol (see Section 2). Representative traces are shown for single cells transfected with NC siRNA (A) or anti-GRK2 siRNA (B). P2Y receptor desensitization was determined as the relative (%) change in R2 response compared with R1. Cumulative data (C) show means ± SEM from 8 to 15 cells from MSMCs prepared from more than four separate animals. Statistical significance is indicated as *P < 0.01 vs. NC siRNA-treated MSMCs (one-way ANOVA; Dunnett's post hoc test).
Figure 6
Figure 6
Depletion of endogenous arrestin2 attenuates P2Y2-receptor desensitization. MSMCs were nucleofected with NC, anti-arrestin2 or anti-arrestin3 siRNAs (100 nM) (see Section 2). After 48 h, cells were lysed and 40 µg of protein loaded for SDS–PAGE separation and immunoblotting. (A) Representative immunoblot showing arrestin2 depletion (upper panel), and the same blot is shown after longer exposure to highlight arrestin3 (lower panel, lower band) depletion, shown in: non-transfected cells (lane 1), or cells treated with 100 nM of anti-arrestin2 (lane 2), anti-arrestin3 (lane 3), or NC (lane 4) siRNAs. (B) Cumulative densitometric data show mean arrestin expression ± SEM from four animal cell preparations, **P<0.01 vs. NC siRNA (one-way ANOVA; Dunnett's post hoc test). To assess the effects of arrestin depletion on UTP- or ET1-stimulated PLC signalling, MSMCs were nucleofected with 0.5 µg eGFP-PH and with 100 nM of either NC, anti-arrestin2 or anti-arrestin3 siRNAs. Cells were loaded with Fura-Red and subjected to the standard R1/Rmax/R2 (for UTP) or R1/R1 (for ET-1) desensitization protocols (see Section 2). Representative traces from single cells transfected with control siRNA (C and F), anti-arrestin2 (D), or anti-arrestin3 (G). Traces (C) and (D) show UTP responses, while (F) and (G) show ET-1 responses. Cumulative data are shown as means ± SEM from 5 to 13 cells from preparations from three to four separate animals for UTP- (E) and ET1-stimulated cells (H). Statistical significance is indicated as *P < 0.05 or **P < 0.01 vs. NC siRNA-treated MSMCs (one-way ANOVA; Dunnett's post hoc test).

Similar articles

Cited by

References

    1. Erlinge D, Burnstock G. P2 receptors in cardiovascular regulation and disease. Purinergic Signal. 2008;4:1–20. doi:10.1007/s11302-007-9078-7. - DOI - PMC - PubMed
    1. Winter P, Dora KA. Spreading dilatation to luminal perfusion of ATP and UTP in rat isolated small mesenteric arteries. J Physiol. 2007;582:335–347. doi:10.1113/jphysiol.2007.135202. - DOI - PMC - PubMed
    1. von Kugelgen I, Haussinger D, Starke K. Evidence for a vasoconstriction-mediating receptor for UTP, distinct from the P2 purinoceptor, in rabbit ear artery. Naunyn Schmiedeberg's Arch Pharmacol. 1987;336:556–560. - PubMed
    1. Malmsjo M, Adner M, Harden TK, Pendergast W, Edvinsson L, Erlinge D. The stable pyrimidines UDPβS and UTPγS discriminate between the P2 receptors that mediate vascular contraction and relaxation of the rat mesenteric artery. Br J Pharmacol. 2000;131:51–56. doi:10.1038/sj.bjp.0703536. - DOI - PMC - PubMed
    1. Abbracchio MP, Burnstock G, Boeynaems JM, Barnard EA, Boyer JL, Kennedy C, et al. International Union of Pharmacology LVIII: update on the P2Y G protein-coupled nucleotide receptors: from molecular mechanisms and pathophysiology to therapy. Pharmacol Rev. 2006;58:281–341. doi:10.1124/pr.58.3.3. - DOI - PMC - PubMed

Publication types

MeSH terms