. 2011 Apr;32(8):1025-38.
doi: 10.1093/eurheartj/ehq253. Epub 2010 Aug 12.

Aldehyde dehydrogenase 2 (ALDH2) rescues myocardial ischaemia/reperfusion injury: role of autophagy paradox and toxic aldehyde

Affiliations

Aldehyde dehydrogenase 2 (ALDH2) rescues myocardial ischaemia/reperfusion injury: role of autophagy paradox and toxic aldehyde

Heng Ma et al. Eur Heart J. 2011 Apr.

Abstract

Aims: The present study was designed to examine the mechanism involved in mitochondrial aldehyde dehydrogenase (ALDH2)-induced cardioprotection against ischaemia/reperfusion (I/R) injury with a focus on autophagy.

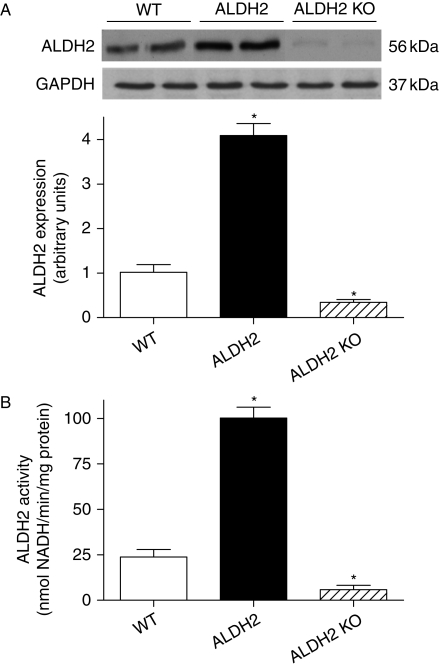
Methods: Wild-type (WT), ALDH2 overexpression, and knockout (KO) mice (n = 4-6 for each index measured) were subjected to I/R, and myocardial function was assessed using echocardiographic, Langendroff, and edge-detection systems. Western blotting was used to evaluate AMP-dependent protein kinase (AMPK), Akt, autophagy, and the AMPK/Akt upstream signalling LKB1 and PTEN.

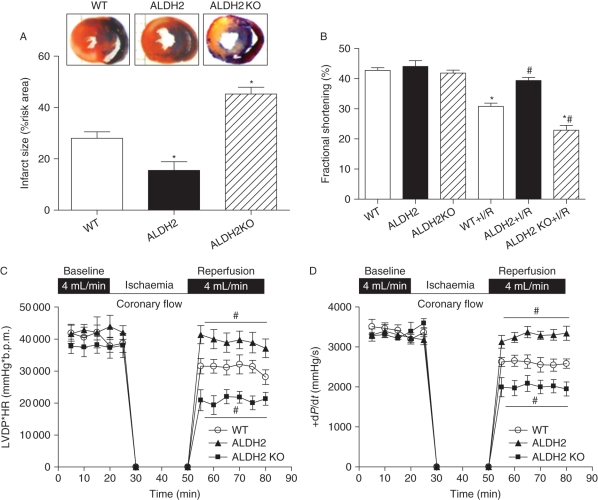
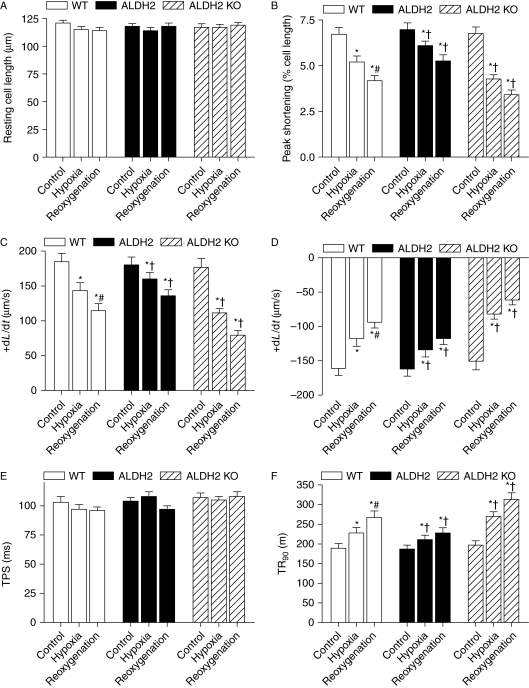
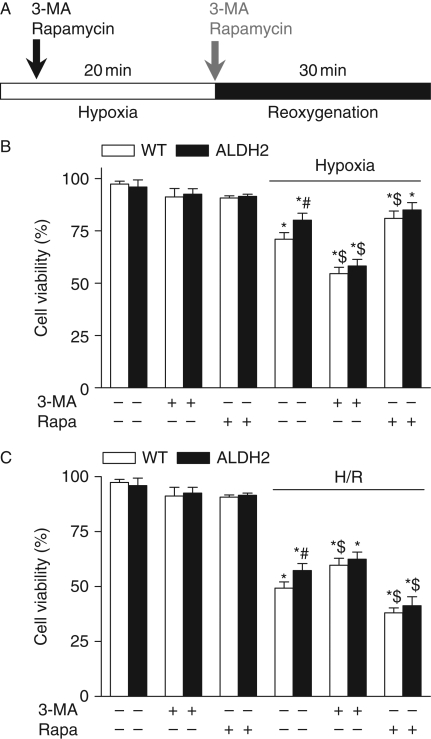
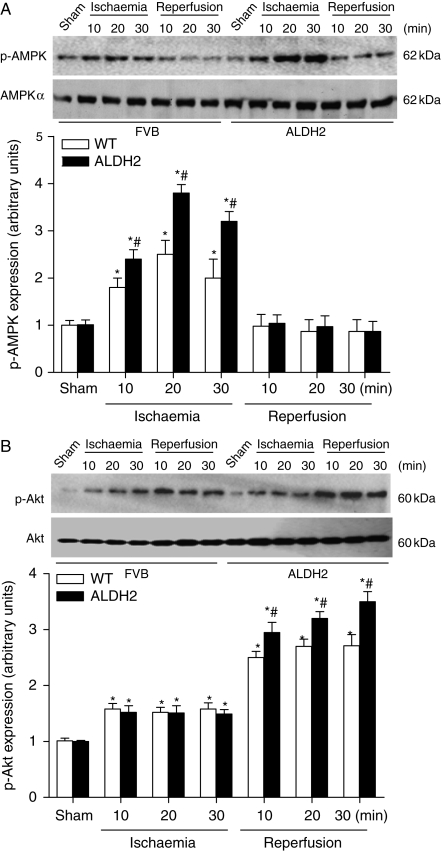
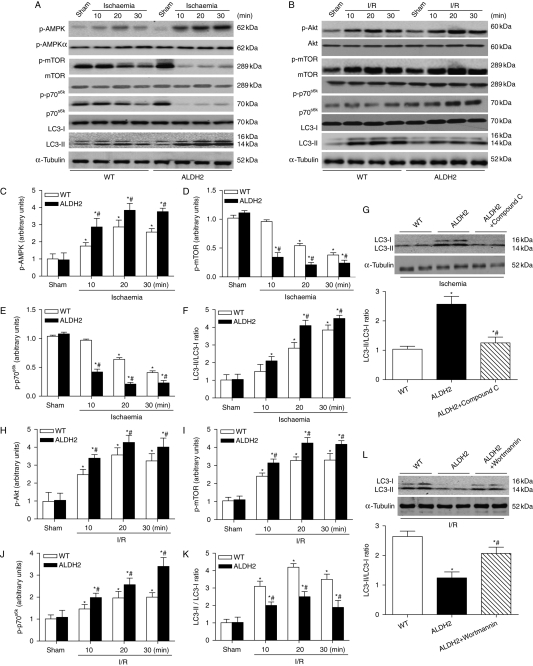
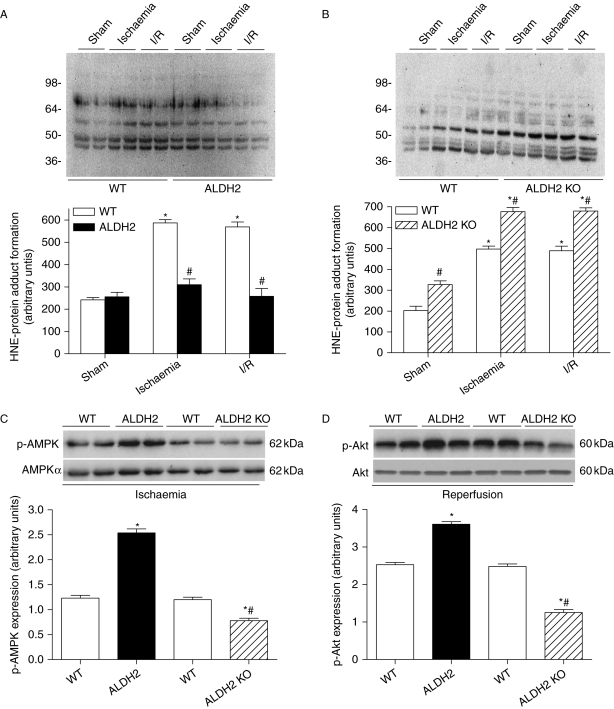
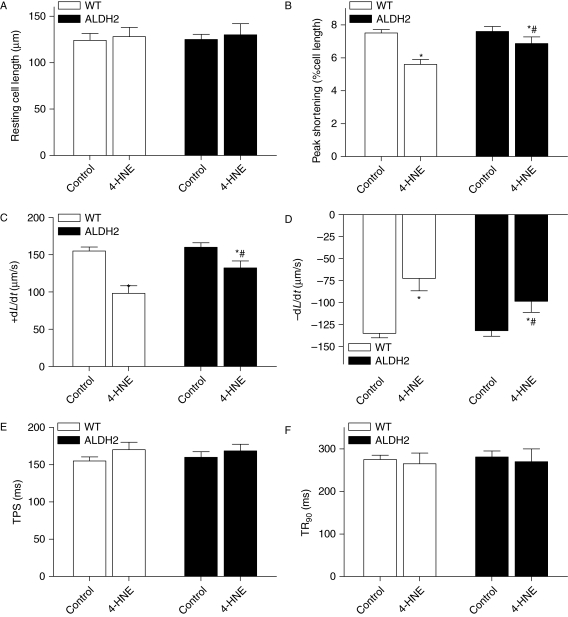
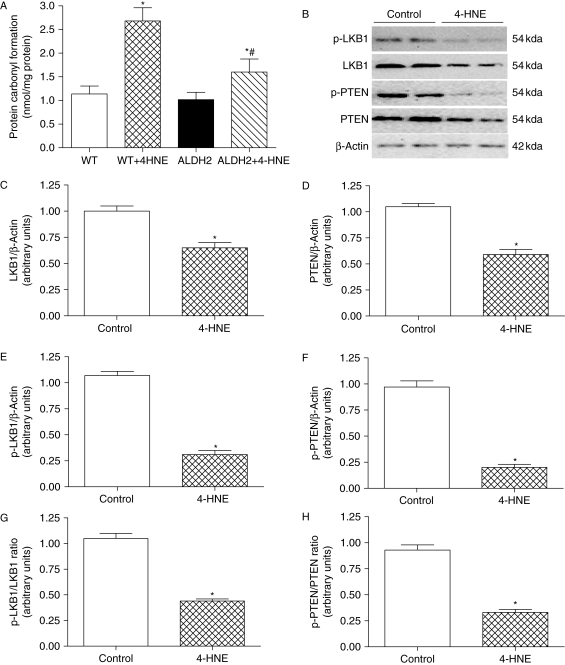
Results: ALDH2 overexpression and KO significantly attenuated and accentuated, respectively, infarct size, factional shortening, and recovery of post-ischaemic left ventricular function following I/R as well as hypoxia/reoxygenation-induced cardiomyocyte contractile dysfunction. Autophagy was induced during ischaemia and remained elevated during reperfusion. ALDH2 significantly promoted autophagy during ischaemia, which was accompanied by AMPK activation and mammalian target of rapamycin (mTOR) inhibition. On the contrary, ALDH2 overtly inhibited autophagy during reperfusion accompanied by the activation of Akt and mTOR. Inhibition and induction of autophagy mitigated ALDH2-induced protection against cell death in hypoxia and reoxygenation, respectively. In addition, levels of the endogenous toxic aldehyde 4-hydroxy-2-nonenal (4-HNE) were elevated by ischaemia and reperfusion, which was abrogated by ALDH2. Furthermore, ALDH2 ablated 4-HNE-induced cardiomyocyte dysfunction and protein damage, whereas 4-HNE directly decreased pan and phosphorylated LKB1 and PTEN expression.

Conclusion: Our data suggest a myocardial protective effect of ALDH2 against I/R injury possibly through detoxification of toxic aldehyde and a differential regulation of autophagy through AMPK- and Akt-mTOR signalling during ischaemia and reperfusion, respectively.


Figures

Figure 1
Figure 1
Validation of ALDH2 transgenic overexpression and knockout (KO). Myocardial ALDH2 protein expression and enzymatic activity were evaluated using western blot analysis and spectrophotometry in wild-type (WT), ALDH2 overexpression, and ALDH2 knockout mice. (A) ALDH2 expression with representative gel blots of ALDH2 and GAPDH (loading control); (B) ALDH2 enzymatic activity; mean ± SEM, n = 5–6 per group, *P < 0.05 vs. WT group.
Figure 2
Figure 2
Effect of ALDH2 overexpression and knockout (KO) on ischaemia/reperfusion (I/R)-induced myocardial injury. Effect of ALDH2 overexpression and KO on myocardial infarct size, fraction shortening, and post-ischaemic left ventricular function was evaluated following ischaemia (20 min)/reperfusion (4 h for panels A and B and 30 min for C and D). (A) Myocardial infarct size with representative tissue sectioning; (B) echocardiographic fraction shortening; (C) left ventricular developed pressure (LVDP)-heart rate (HR) product; and (D) maximal velocity of pressure development (+dP/dt). Mean ± SEM, n = 5–6 hearts per group, *P < 0.05 vs. wild-type (WT) group, #P < 0.05 vs. WT + I/R group.
Figure 3
Figure 3
Cardiomyocyte contractile properties following hypoxia/reoxygenation. Effect of ALDH2 overexpression and knockout (KO) on hypoxia/reoxygenation-induced cardiomyocyte dysfunction was evaluated. Cardiomyocytes were subjected to hypoxia (95% nitrogen/5% CO2) for 20 min followed with or without a 30 min reoxygenation (room air/5% CO2). (A) Resting cell length; (B) peak shortening (PS, normalized to cell length); (C) maximal velocity of shortening (+dL/dt); (D) maximal velocity of relengthening (−dL/dt); (E) time-to-PS (TPS) and (F) time-to-90% relengthening (TR90). Mean ± SEM, n = 68–74 cells from four mice per group, *P < 0.05 vs. respective control group, #P < 0.05 vs. wild-type (WT) hypoxia group, †P < 0.05 vs. respective WT hypoxia or reoxygenation group.
Figure 4
Figure 4
Cell viability of cardiomyocytes following hypoxia–reoxygenation. Cell viability was examined using MTT assay in cardiomyocytes from wild-type (WT) and ALDH2 overexpression mice subjected to a 20 min hypoxia or a 20 min hypoxia followed by a 30 min reoxygenation (H/R) in the presence or absence of the autophagy inhibitor 3-MA (10 mmol/L) or the autophagy inducer rapamycin (Rapa, 100 nmol/L). (A) Experimental protocol; (B) cell viability under hypoxia; and (C) cell viability under H/R. Mean ± SEM, n = 5, *P < 0.05 vs. WT without inhibitor treatment, #P < 0.05 vs. respective WT hypoxia or H/R group, $P < 0.05 vs. respective WT hypoxia or H/R in the absence of 3-MA or rapamycin.
Figure 5
Figure 5
Phosphorylation of AMP-dependent protein kinase (AMPK) and Akt during ischaemia and reperfusion. Time course of in vivo ischaemia (10, 20, and 30 min) or reperfusion (10, 20, and 30 min) preceded by a 20 min ischaemia on phosphorylation of AMPK (A) and Akt (B) was evaluated in murine myocardium from wild-type (WT) and ALDH2 overexpression mice. Inset: Representative gel blots depicting total and phosphorylation of AMPK or Akt. Mean ± SEM, n = 4 hearts, *P < 0.05 vs. respective sham group, #P < 0.05 vs. respective WT ischaemia or reperfusion group.
Figure 6
Figure 6
Autophagy signalling pathway. Effect of ALDH2 overexpression on ischaemia or ischaemia/reperfusion-induced phosphorylation of AMP-dependent protein kinase (AMPK), Akt, mammalian target of rapamycin (mTOR), and p70s6k as well as autophagy (LC3-I/II) was examined in myocardium from wild-type (WT) and ALDH2 overexpression mice. (A, CF) Hearts were subjected to in vivo ischaemia (10, 20, and 30 min). (A) Representative gel bolts depicting respective protein expression using specific antibodies; (C) phosphorylated AMPK (p-AMPK); (D) phosphorylated mTOR (p-mTOR); (E) phosphorylated p70s6k (p-p70s6k); and (F) LC3-II-to-LC3-I ratio. Mean ± SEM, n = 5, *P < 0.05 vs. sham, #P < 0.05 vs. respective WT ischaemia group. (G) Cardiomyocytes were subjected to 20 min hypoxia (95% nitrogen/5% CO2) in vitro with or without the pre-treatment of the AMP-dependent protein kinase (AMPK) inhibitor compound C (10 mmol/L) for 5 min. (B, HK) Hearts were subjected to in vivo ischaemia (20 min) followed by reperfusion (10, 20, and 30 min). (B) Representative gel bolts depicting respective protein expression using specific antibodies; (H) phosphorylated Akt (p-Akt); (I) phosphorylated mammalian target of rapamycin (mTOR) (p-mTOR); (J) phosphorylated p70s6k (p-p70s6k); and (K) LC3-II-to-LC3-I ratio. n = 5, *P < 0.05 vs. sham, #P < 0.05 vs. respective WT ischaemia/reperfusion (I/R) group. (L) Cardiomyocytes were subjected to 20 min hypoxia and 30 min reoxygenation in vitro with or without the pre-treatment of the Akt inhibitor wortmannin (100 nmol/L) for 5 min. Insets: Representative gel blots depicting autophagy proteins LC3-I and LC3-II. For panels G and L, mean ± SEM, n = 5, *P < 0.05 vs. WT group, #P < 0.05 vs. ALDH2 group.
Figure 7
Figure 7
4-HNE-protein adducts formation and differential phosphorylation of AMP-dependent protein kinase (AMPK)/Akt. (A) HNE-protein adducts formation evaluated with immunoblotting in hearts from wild-type (WT) and ALDH2 overexpression mice subjected to ischaemia or ischaemia/reperfusion (I/R). Inset: Representative gel blots depicting HNE-protein adducts formation. Molecular protein standards are shown on the left. The density of staining in each lane was assessed as a whole to generate a single value of the integrated density of all HNE-protein adducts formed within that lane; (B) HNE-protein adducts formation in hearts from WT and ALDH2 KO mice using immunoblotting; (C) In vivo regional ischaemia (20 min)-stimulated differential phosphorylation of AMPK in WT, ALDH2 overexpression, and ALDH2 KO mouse hearts. Inset: Representative gel blots depicting total and phosphorylation AMPK; and (D) in vivo regional ischaemia (20 min)/reperfusion (30 min)-stimulated differential phosphorylation of Akt in WT, ALDH2 overexpression, and ALDH2 KO mouse hearts. Inset: Representative gel blots depicting total and phosphorylation Akt. Mean ± SEM, n = 6–8, *P < 0.05 vs. sham or WT group under basal condition, #P < 0.05 vs. corresponding WT or ALDH2 group under ischaemia or I/R condition.
Figure 8
Figure 8
4-HNE-induced cardiomyocyte contractile dysfunction. Cardiomyocytes from wild-type (WT) and ALDH2 overexpression mice were incubated with 4-HNE (20 µmol/L) or vehicle for 50 min before cardiomyocyte mechanical function was assessed. (A) Resting cell length; (B) peak shortening (PS, normalized to cell length); (C) maximal velocity of shortening (+dL/dt); (D) maximal velocity of relengthening (−dL/dt); (E) time-to-PS (TPS); and (F) time-to-90% relengthening (TR90). Mean ± SEM, n = 150–200 cells from three mice per group, *P < 0.05 vs. respective control, #P < 0.05 vs. 4-HNE group from WT mice.
Figure 9
Figure 9
Effect of 4-HNE on carbonyl formation, phosphorylation of LKB1 and PTEN. Cardiomyocytes from wild-type (WT) or ALDH2 overexpression mice were incubated with 4-HNE (20 µmol/L) or vehicle for 50 min prior to the assessment of carbonyl, total, and phosphorylated LKB1 and PTEN. (A) Carbonyl formation; (B) representative gel blots of total and phosphorylated LKB1 and PTEN (β-actin was used as loading control); (C and D) total LKB1 and PTEN expression; (E and F) phosphorylated LKB1 and PTEN; (G and H) phosphorylated-to-pan protein ratio of LKB1 and PTEN. Mean ± SEM, n = 5, *P < 0.05 vs. WT or control group, #P < 0.05 vs. WT + 4-NHE group.

Similar articles

Cited by

References

    1. Ren J. Acetaldehyde and alcoholic cardiomyopathy: lessons from the ADH and ALDH2 transgenic models. Novartis Found Symp. 2007;285:69–76. Discussion 76–69, 198–199. doi:10.1002/9780470511848.ch5. - DOI - PubMed
    1. Daiber A, Wenzel P, Oelze M, Munzel T. New insights into bioactivation of organic nitrates, nitrate tolerance and cross-tolerance. Clin Res Cardiol. 2008;97:12–20. doi:10.1007/s00392-007-0588-7. - DOI - PubMed
    1. Li SY, Li Q, Shen JJ, Dong F, Sigmon VK, Liu Y, Ren J. Attenuation of acetaldehyde-induced cell injury by overexpression of aldehyde dehydrogenase-2 (ALDH2) transgene in human cardiac myocytes: role of MAP kinase signaling. J Mol Cell Cardiol. 2006;40:283–294. doi:10.1016/j.yjmcc.2005.11.006. - DOI - PubMed
    1. Li SY, Ren J. Cardiac overexpression of alcohol dehydrogenase exacerbates chronic ethanol ingestion-induced myocardial dysfunction and hypertrophy: role of insulin signaling and ER stress. J Mol Cell Cardiol. 2008;44:992–1001. doi:10.1016/j.yjmcc.2008.02.276. - DOI - PMC - PubMed
    1. Chen CH, Budas GR, Churchill EN, Disatnik MH, Hurley TD, Mochly-Rosen D. Activation of aldehyde dehydrogenase-2 reduces ischemic damage to the heart. Science (New York, NY) 2008;321:1493–1495. - PMC - PubMed

Publication types

MeSH terms