. 2010 Oct;21(10):1702-12.
doi: 10.1681/ASN.2010030238. Epub 2010 Aug 12.

Heme oxygenase-1 inhibits renal tubular macroautophagy in acute kidney injury

Affiliations

Heme oxygenase-1 inhibits renal tubular macroautophagy in acute kidney injury

Subhashini Bolisetty et al. J Am Soc Nephrol. 2010 Oct.

Abstract

Autophagy is a tightly regulated, programmed mechanism to eliminate damaged organelles and proteins from a cell to maintain homeostasis. Cisplatin, a chemotherapeutic agent, accumulates in the proximal tubules of the kidney and causes dose-dependent nephrotoxicity, which may involve autophagy. In the kidney, cisplatin induces the protective antioxidant heme oxygenase-1 (HO-1). In this study, we examined the relationship between autophagy and HO-1 during cisplatin-mediated acute kidney injury (AKI). In wild-type primary proximal tubule cells (PTC), we observed a time-dependent increase in autophagy after cisplatin. In HO-1(-/-) PTC, however, we observed significantly higher levels of basal autophagy, impaired progression of autophagy, and increased apoptosis after cisplatin. Restoring HO-1 expression in these cells reversed the autophagic response and inhibited apoptosis after treatment with cisplatin. In vivo, although both wild-type and HO-1-deficient mice exhibited autophagosomes in the proximal tubules of the kidney in response to cisplatin, HO-1-deficient mice had significantly more autophagosomes, even in saline-treated animals. In addition, ecdysone-induced overexpression of HO-1 in cells led to a delay in autophagy progression, generated significantly lower levels of reactive oxygen species, and protected against cisplatin cytotoxicity. These findings demonstrate that HO-1 inhibits autophagy, suggesting that the heme oxygenase system may contain therapeutic targets for AKI.


Figures

Figure 1.
Figure 1.
Higher number of autophagic vacuoles even in the saline-treated HO-1−/− mouse kidneys. Upper panels: Representative electron micrographs of HO-1+/+ and HO-1−/− kidney cortex. Magnification, ×12,000; scale bar, 2 μm. Lower panels: Representative higher magnification electron micrographs showing the presence of individual autophagic vesicles. Arrows indicate autophagosomes with double-membraned vesicles. Magnification, ×30,000; scale bar, 500 nm; n = 3 per group.
Figure 2.
Figure 2.
Increased punctated LC3 expression in saline-treated HO-1−/− mouse kidneys. Representative immunohistochemical staining for LC3 puncta (arrows) on paraffin-embedded kidney sections in HO-1+/+ and HO-1−/− mice administered saline or cisplatin. Scale bar, 10 μm. Inset: Higher magnification of a proximal tubule with LC3 expression showing LC3 puncta in HO-1+/+ cisplatin-treated animals and HO-1−/− saline and cisplatin-treated animals; n = 3 to 6 per group.
Figure 3.
Figure 3.
HO-1−/− primary proximal tubular epithelial cells (PTC) display blunted autophagy gene responses following cisplatin treatment. (A and B) Real-time PCR analysis of Atg5 (A) and Atg7 (B) expression in HO-1+/+ and HO-1−/− PTC after cisplatin treatment. Results were normalized to GAPDH expression and expressed as fold change compared with their untreated controls. *P < 0.05 versus HO-1−/−.
Figure 4.
Figure 4.
HO-1−/− PTC are unable to induce autophagy proteins following cisplatin treatment (50 μM) compared to HO-1+/+ PTC. Cell lysates were analyzed for expression of (A) LC3, (B) beclin, and (C) cleaved caspase-3 by Western blot analysis at the indicated times. The blots were stripped and probed for HO-1 and actin to confirm phenotype and loading, respectively.
Figure 5.
Figure 5.
HO-1 expression restores the autophagy response and inhibits apoptosis following cisplatin treatment in PTC isolated from human HO-1 overexpressing bacterial artificial chromosome (HBAC) mice. (A) HBAC cells were treated with cisplatin (50 μM) and cell lysates were analyzed for expression of HO-1, LC3, and Atg5. (B) HO-1+/+, HO-1−/−, and HBAC PTC were treated with 50 μM cisplatin for 24 hours and cell lysates were analyzed for cleaved caspase-3 levels. The blots were stripped and probed for actin to confirm loading.
Figure 6.
Figure 6.
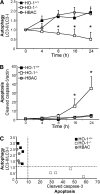
Lack of autophagy induction in HO-1−/− PTC correlates with increased apoptosis during cisplatin injury. (A) Densitometric analysis of LC3-II change (for autophagy) with cisplatin treatment. LC3-I was used as an internal loading control. *P < 0.05 versus HO-1+/+ and HBAC. (B) Densitometric analysis of increase in cleaved caspase-3 (for apoptosis) with cisplatin treatment. Actin was used as an internal loading control. *P < 0.05 versus HO-1+/+ and HBAC. (C) Correlation between autophagosome formation (LC3-II/LC3-I) and apoptosis (cleaved caspase-3/actin) after 24 hours with cisplatin. The horizontal dashed line represents the basal autophagy.
Figure 7.
Figure 7.
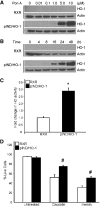
Inducible HO-1 (pIND/HO-1) overexpressing cells are protected against hemin- and cisplatin-mediated cytotoxicity. HEK293 cells were stably transfected with pIND/HO-1 (pIND/HO-1) and/or pVgRXR (RXR) plasmids and tested for HO-1 expression. (A) Western blot analysis for HO-1 in RXR and pIND/HO-1 stable cells treated with indicated doses of ponasterone A for 24 hours. (B) Western blot analysis for HO-1 in RXR and pIND/HO-1 stable cells treated with 5 μM Pon A for various times indicated. (C) HO enzyme activity was measured in RXR and pIND/HO-1 stable cells treated with 5 μM Pon A for 24 hours as described in Concise Methods. *P < 0.05 versus RXR. (D) RXR and pIND/HO-1 stable cells were treated with 5 μM Pon A for 24 hours, followed by treatment with cisplatin (100 μM) or hemin (50 μM) for 24 hours. Cell viability was determined by trypan blue exclusion assay and plotted as % live cells. #P < 0.01 versus RXR.
Figure 8.
Figure 8.
HO-1 overexpressing cells (pIND/HO-1) exhibit delayed autophagosome formation in response to cisplatin injury. RXR and pIND/HO-1 cells were transfected with GFP-LC3 plasmid and induced with 5 μM Pon A for 24 hours, followed by treatment with 50 μM cisplatin. At the indicated times, fluorescence images were taken, blinded, and quantitated for the presence of GFP-LC3 puncta. (A) Representative images of GFP-LC3 expression in stable cells treated with cisplatin. Formation of GFP-LC3 puncta was visible in stable cells treated with cisplatin for 24 hours compared with the diffused pattern of GFP-LC3 at 0 hours. (B) GFP-positive cells with diffuse and punctated GFP-LC3 were counted and quantitation was performed on 12 images per time point with an average of 50 cells from at least three independent experiments and expressed as % GFP cells with puncta. *P < 0.05 versus RXR.
Figure 9.
Figure 9.
Reduced production of reactive oxygen species (ROS) in HO-1 overexpressing (pIND/HO-1) cells after cisplatin treatment. Ecdysone-inducible stable clones were treated with cisplatin (50 μM) for the indicated times and cells were loaded with 2.5 μM H2DCF-DA for 1 hour. (A) Cells were imaged for DCF fluorescence by confocal microscopy. (B) Fluorescence intensity was measured in 8 fields and at least 40 different regions of interest per field and averaged from four independent experiments. Results are expressed as fold increase in DCF fluorescence (ROS) in cisplatin-treated cells compared with untreated cells. *P < 0.05 versus 4-hour-treated RXR group.
Figure 10.
Figure 10.
Schematic showing the role of HO-1, ROS, and heme in autophagy. During cisplatin injury (black arrows), increased ROS leads to destabilization of heme-containing proteins and increased free heme levels in the cell. Autophagy and HO-1 are induced during this insult to overcome the oxidative stress and serve as adaptive responses to protect from cell death. In the absence of HO-1 (blue arrows), the oxidative environment in the cell is further exaggerated after cisplatin by an increase in levels of free unmetabolized heme (substrate), heightened generation of ROS, and oxidative stress, thereby leading to dysregulated autophagy and cell death. Overexpression of HO-1 (orange arrows) limits heme accumulation, ROS generation, and oxidative stress during cisplatin injury, and hence delays the onset of autophagy and promotes survival.

Comment in

  • HO-1 in control of a self-eating kidney.
    Kapitsinou PP, Haase VH. Kapitsinou PP, et al. J Am Soc Nephrol. 2010 Oct;21(10):1600-2. doi: 10.1681/ASN.2010080876. Epub 2010 Sep 9. J Am Soc Nephrol. 2010. PMID: 20829407 Free PMC article. No abstract available.

References

    1. Baliga R, Ueda N, Walker PD, Shah SV: Oxidant mechanisms in toxic acute renal failure. Am J Kidney Dis 29: 465–477, 1997 - PubMed
    1. Devarajan P: Update on mechanisms of ischemic acute kidney injury. J Am Soc Nephrol 17: 1503–1520, 2006 - PubMed
    1. Agarwal A, Balla J, Alam J, Croatt AJ, Nath KA: Induction of heme oxygenase in toxic renal injury: A protective role in cisplatin nephrotoxicity in the rat. Kidney Int 48: 1298–1307, 1995 - PubMed
    1. Nath KA: Heme oxygenase-1: A provenance for cytoprotective pathways in the kidney and other tissues. Kidney Int 70: 432–443, 2006 - PubMed
    1. Agarwal A, Nick HS: Renal response to tissue injury: Lessons from heme oxygenase-1 gene ablation and expression. J Am Soc Nephrol 11: 965–973, 2000 - PubMed

Publication types