. 2010 Nov 11;116(19):4025-33.
doi: 10.1182/blood-2010-02-270819. Epub 2010 Aug 12.

Identification and functional analysis of endothelial tip cell-enriched genes

Affiliations

Identification and functional analysis of endothelial tip cell-enriched genes

Raquel del Toro et al. Blood. .

Abstract

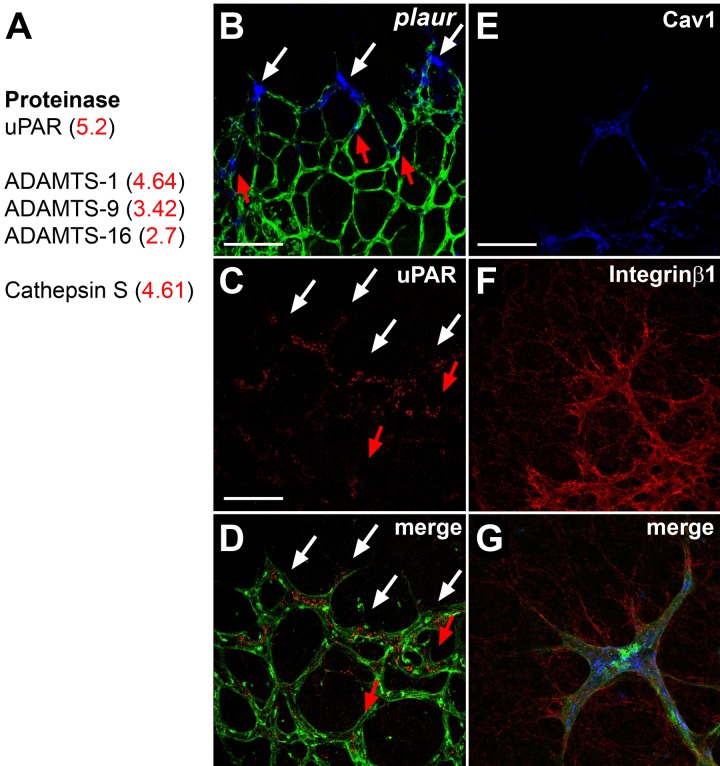
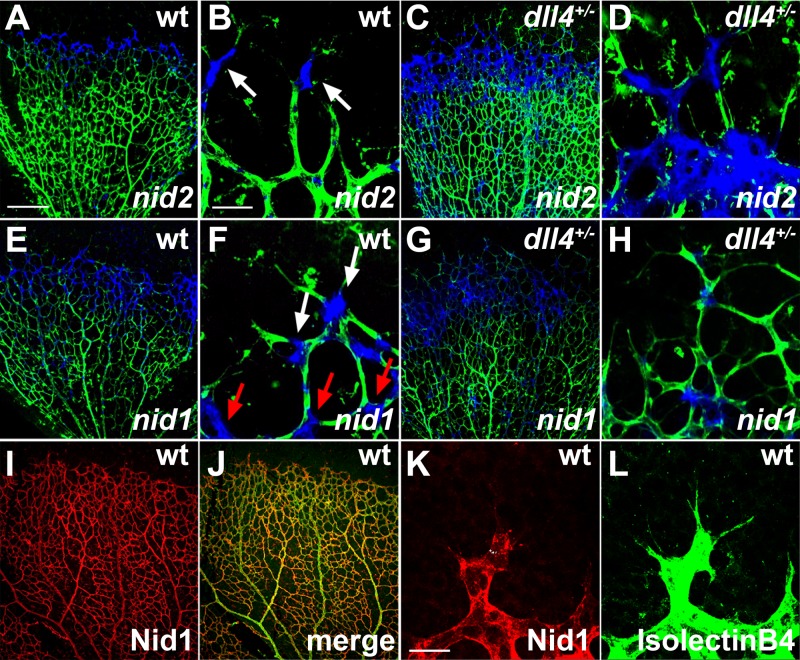
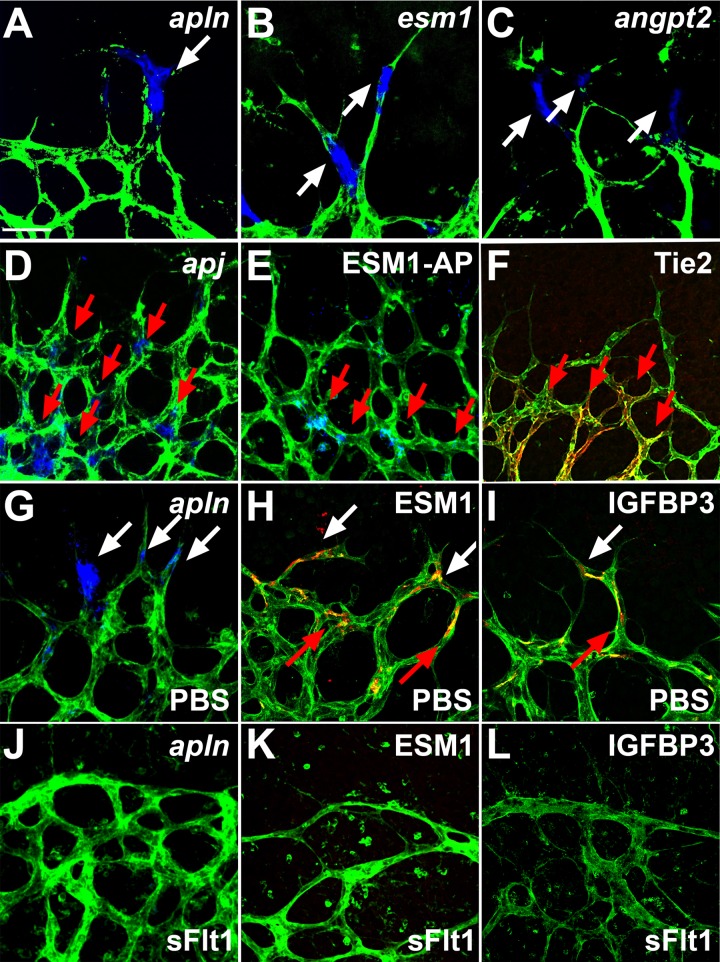
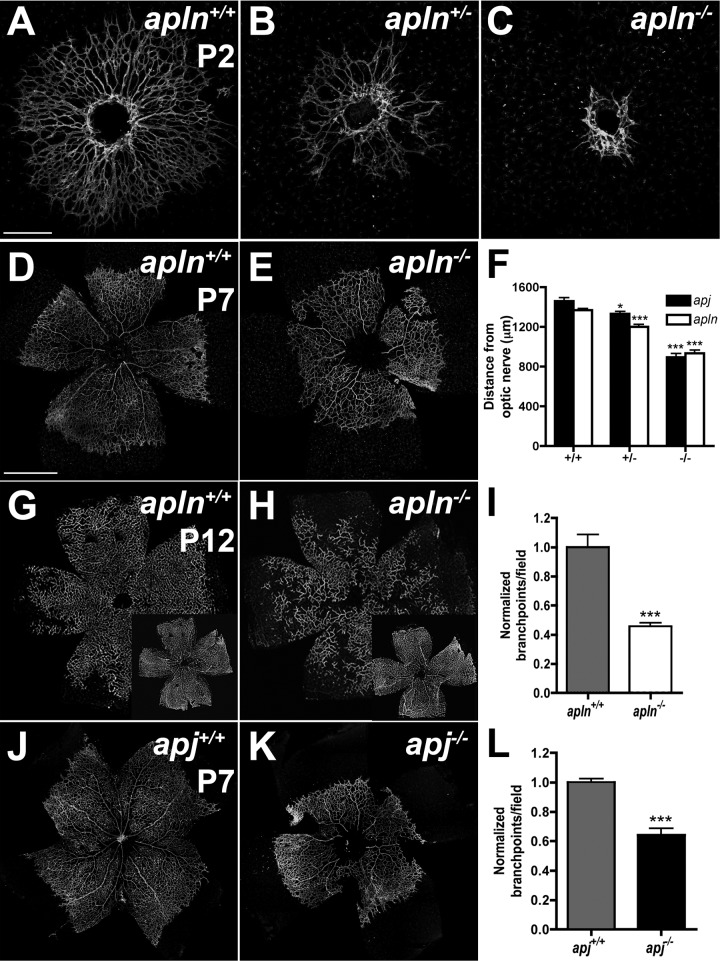
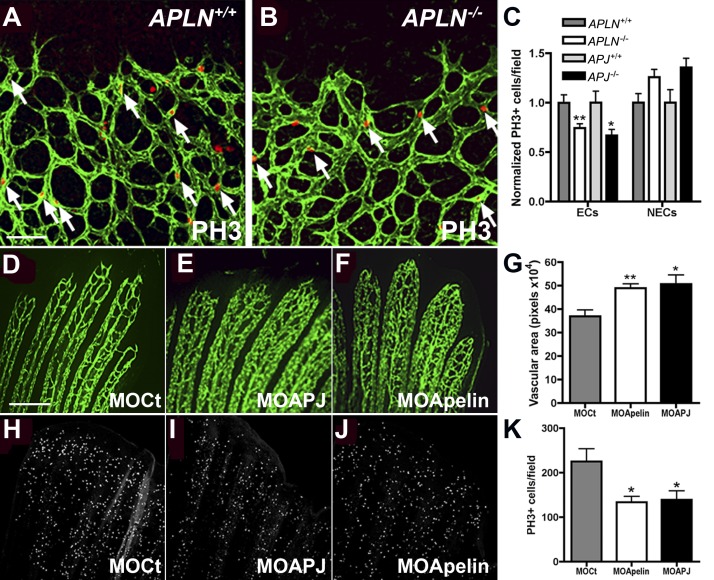
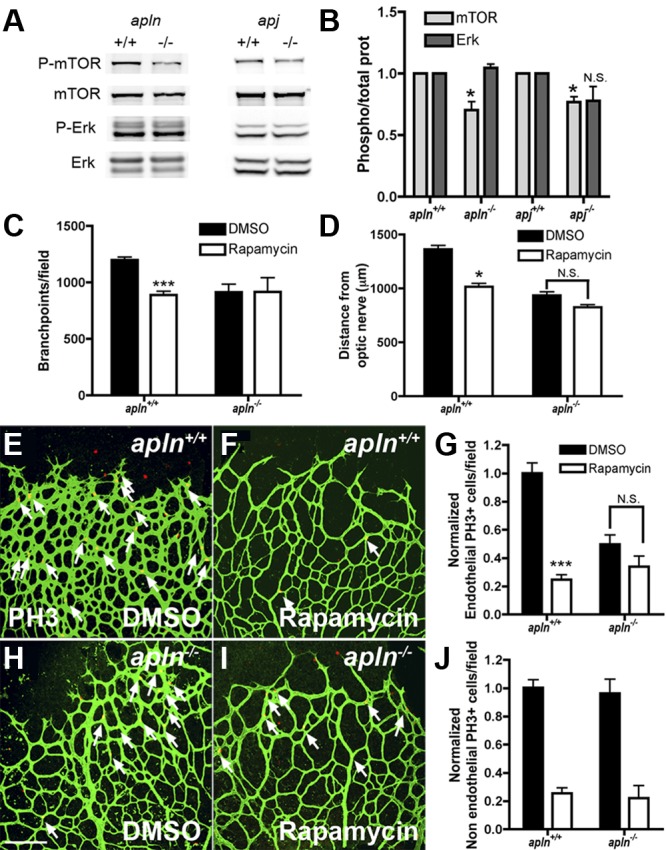
Sprouting of developing blood vessels is mediated by specialized motile endothelial cells localized at the tips of growing capillaries. Following behind the tip cells, endothelial stalk cells form the capillary lumen and proliferate. Expression of the Notch ligand Delta-like-4 (Dll4) in tip cells suppresses tip cell fate in neighboring stalk cells via Notch signaling. In DLL4(+/-) mouse mutants, most retinal endothelial cells display morphologic features of tip cells. We hypothesized that these mouse mutants could be used to isolate tip cells and so to determine their genetic repertoire. Using transcriptome analysis of retinal endothelial cells isolated from DLL4(+/-) and wild-type mice, we identified 3 clusters of tip cell-enriched genes, encoding extracellular matrix degrading enzymes, basement membrane components, and secreted molecules. Secreted molecules endothelial-specific molecule 1, angiopoietin 2, and apelin bind to cognate receptors on endothelial stalk cells. Knockout mice and zebrafish morpholino knockdown of apelin showed delayed angiogenesis and reduced proliferation of stalk cells expressing the apelin receptor APJ. Thus, tip cells may regulate angiogenesis via matrix remodeling, production of basement membrane, and release of secreted molecules, some of which regulate stalk cell behavior.


Figures

Figure 1
Figure 1
Tip cell–enriched genes include proteases. (A) The proteases up-regulated in DLL4+/− retinas by microarray analysis include uPAR, members of the ADAMTS family and Cathepsin S. Fold change in DLL4+/− compared with wild-type is shown in red. (B) Whole mount ISH for plaur (blue) on retinas counterstained for isolectinB4 (green). Plaur shows preferential expression in tip cells (white arrows). Some stalk cells also express PLAUR (red arrows). (C-D) Immunohistochemistry confirms an enhanced expression of uPAR in tip cells (white arrows) and some uPAR positive stalk cells (red arrows). (E-G) Antibody staining shows that Caveolin-1 (blue) and Integrinβ1 (red) are also expressed by IsolectinB4 positive tip cells (green). The pictures represent 1 of 3 independent experiments with similar results. Scale bars: (B-D) 50 μm; (E-G) 5 μm. Images of antibody stainings were acquired on a Leica TCS SP5 confocal microscope using a 63×/1.4 NA objective. Images of ISH were acquired on an Olympus BX50 microscope using a 20×/0.05 NA objective and captured using a Coolsnap camera (Roper) through IPLab software version 3.2.4 (BioVision Technologies). Vessels were visualized with IsolectinB4 directly conjugated to AlexaFluor488 and the ISH signal by bright-field microscopy. Single channels were converted to grayscale (ISH in blue) in Photoshop CS2 (Adobe Systems) and merged in ImageJ (National Institutes of Health).
Figure 2
Figure 2
Tip cells express basement membrane components. (A-B) Whole mount ISH (blue) confirmed enhanced Nidogen-2 (nid2) expression in tip cells of wild-type mice (white arrows) and a broader expression in DLL4+/− mice (C-D). (E-F) Nidogen-1 (nid1) mRNA (blue) is expressed in the vascular front of wild-type mice, including tip cells (white arrows) and stalk cells (red arrows). (G-H) Nidogen-1 mRNA is up-regulated in DLL4+/− mice. (I-L) Whole mount immunohistochemistry revealed Nidogen-1 protein (red) in the basement membrane of all retinal vessels in wild-type mice, at the exclusion of filopodia (K-L). IsolectinB4 was used to counterstain vessels (green). The pictures represent 1 of 3 independent experiments with similar results. Scale bars: (A,C,E,G,I,J) 250 μm; (B,D,F,H) 50 μm; (K-L) 40 μm. Images of antibody stainings were acquired on a Leica TCS SP5 confocal microscope using a 10×/0.3 or 63×/1.4 NA objective. Images of ISH were acquired on an Olympus BX50 microscope using a 4×/0.16 NA or 20×/0.05 NA objective and captured using a Coolsnap camera through IPLab software version 3.2.4. Vessels were visualized with IsolectinB4 directly conjugated to AlexaFluor488 and the ISH signal by bright-field microscopy. Single channels were converted to grayscale in Photoshop CS2 and merged in ImageJ (ISH in blue).
Figure 3
Figure 3
Tip cells express secreted molecules that bind to stalk cells and are regulated by VEGF. (A-C) Whole mount ISH revealed tip cell expression (white arrows) of apelin (APLN), ESM1, and ANGPT2 (blue). (D) Whole mount ISH revealed expression of apj in stalk cells (red arrows). (E) ESM-1-AP fusion protein binds to stalk cells (red arrows). (F) Tie2 was detectable by antibody staining in stalk cells (red arrows) but not in tip cells. (G-L) Compared with PBS control injection (G-I), sFlt injection (J-L) leads to a decrease in APLN, ESM-1, and IGFBP3 expression. Vessels were stained with IsolectinB4 (green). The pictures represent 1 of 3 independent experiments with similar results. Scale bar 50 μm. Images of antibody stainings were acquired on a Leica TCS SP5 confocal microscope using a 63×/1.4 NA objective. Images of ISH were acquired on an Olympus BX50 microscope using a 20×/0.05 NA objective and captured using a Coolsnap camera through IPLab software version 3.2.4. Vessels were visualized with IsolectinB4 directly conjugated to AlexaFluor488 and the ISH and alkaline phosphatase signal by brightfield microscopy. Single channels were converted to grayscale in Photoshop CS2 and merged in ImageJ (ISH in blue).
Figure 4
Figure 4
apln- and apj-deficient mice have impaired retinal vessel outgrowth. IsolectinB4 (green) staining visualizes the impaired retinal vessel outgrowth in APLN+/− and APLN−/− mice compared with wild-type mice at P2 (A-C) and P7 (D-E). (F) Quantification of vessel outgrowth in wild-type, APJ-, and apln-deficient mice at P7. (G-H) Vessel growth into deeper layers at P12 is delayed in apln−/− mice compared with wild-type mice. (J-K) Delay in vessel outgrowth in apj-deficient mice. (I,L) Quantification of branchpoints in APLN−/− and APJ−/− retinas compared with wild-type littermates, respectively. ***P < .001. *P < .05. Mann-Whitney test was used. n = 6 mice per group. Error bars indicate SEM. Scale bars indicate 300 μm (A-C); 600 μm (D,E,G,H,J,K). Images of antibody stainings were acquired on a Leica TCS SP5 confocal microscope using a 10×/0.3 NA objective.
Figure 5
Figure 5
Endothelial cell proliferation is reduced in the absence of Apelin or APJ. (A-B) Whole mount immunohistochemistry for PH3 (red) on APLN+/+ and APLN−/− retinas counterstained with IsolectinB4 (green). Quantification in panel C shows that there are less PH3-positive ECs in APLN−/− and APJ−/− retinas compared with wild-type littermates. The number of PH3-positive cells in the non-ECs (NECs) is not significantly different from the wild-type. N = 7 mice for APLN+/+ and APLN−/− and N = 3 for APJ+/+ and APJ−/−. (D-K) apelin and apj (apj1A and B) were knocked down in zebrafish using specific morpholinos (MO). After 3 days of remodelling, the vascular area in the bony rays was quantified (G). (H-K) Quantification of PH3 positive ECs showed less ECs undergoing mitosis in the caudal fin electroporated with MOs against APLN and APJ. **P < .01. *P < .05. N = 4 experiments, 3 fish per group. Mann-Whitney test was used. Error bars indicate SEM. Scale bars indicate 80 μm (A-B) and 100 μm (D-F, H-J). Images of retinas were acquired on a Leica TCS SP5 confocal microscope using 10×/0.3 NA objective and images of zebrafish fins using a 10×/0.25 NA objective.
Figure 6
Figure 6
Apelin regulates retinal endothelial cell proliferation through the mTOR pathway. (A) Protein extracts from APLN- and APJ-deficient retinas were analyzed by Western blot for mTOR and ERK-phosphorylation. Total ERK and mTOR were used as loading controls. (B) Quantification of band intensities from Western blots (4 different protein extractions). The ratio of P-mTOR/total mTOR and P-Erk/total Erk in APLN+/+ and APJ+/+ was set at 1. (C) Quantification of the branch points in the retinal vasculature following rapamycin injection in wild-type or apln-deficient mice. (D) Quantification of the distance from the optic nerve following rapamycin injection in wild-type or apln-deficient mice. (E-J) PH3 staining (red) of the retina after rapamycin injection shows a decrease in proliferating ECs in wild-type mice, whereas the APLN−/− ECs are not further affected. Vessels were stained with isolectinB4 (green). The number of PH3 stained NECs is decreased in both wild-type and APLN−/− mice. ***P < .001. *P < .05. Mann-Whitney test was used. Error bars indicate SEM. Scale bar indicates 80 μm. Images of antibody stainings were acquired on a Leica TCS SP5 confocal microscope using a 20×/0.7 NA objective.

Similar articles

Cited by

References

    1. Gerhardt H, Golding M, Fruttiger M, et al. VEGF guides angiogenic sprouting utilizing endothelial tip cell filopodia. J Cell Biol. 2003;161(6):1163–1177. - PMC - PubMed
    1. Tammela T, Zarkada G, Wallgard E, et al. Blocking VEGFR-3 suppresses angiogenic sprouting and vascular network formation. Nature. 2008;454(7204):656–660. - PubMed
    1. Isogai S, Lawson ND, Torrealday S, Horiguchi M, Weinstein BM. Angiogenic network formation in the developing vertebrate trunk. Development. 2003;130(21):5281–5290. - PubMed
    1. Lobov IB, Renard RA, Papadopoulos N, et al. Delta-like ligand 4 (Dll4) is induced by VEGF as a negative regulator of angiogenic sprouting. Proc Natl Acad Sci U S A. 2007;104(9):3219–3224. - PMC - PubMed
    1. Noguera-Troise I, Daly C, Papadopoulos NJ, et al. Blockade of Dll4 inhibits tumour growth by promoting non-productive angiogenesis. Nature. 2006;444(7122):1032–1037. - PubMed

Publication types

MeSH terms