. 2010 Sep 14;107(37):16016-22.
doi: 10.1073/pnas.1004037107. Epub 2010 Aug 12.

Fast live simultaneous multiwavelength four-dimensional optical microscopy

Affiliations

Fast live simultaneous multiwavelength four-dimensional optical microscopy

Peter M Carlton et al. Proc Natl Acad Sci U S A. .

Abstract

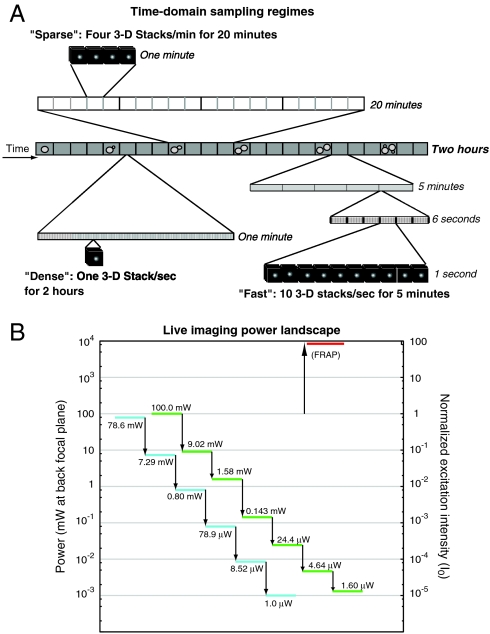
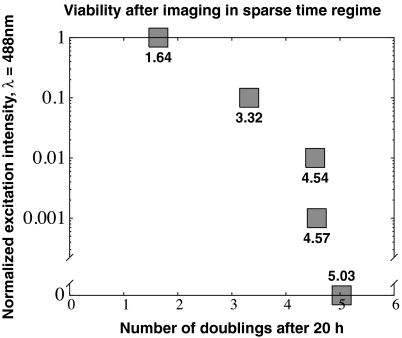
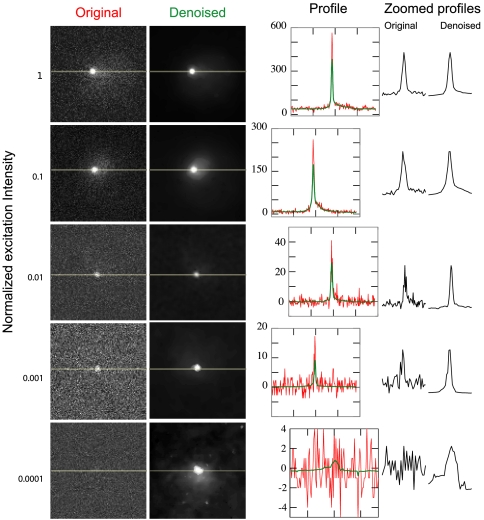
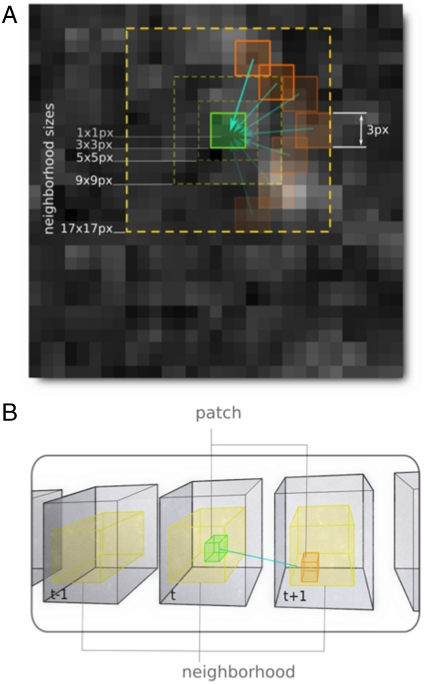
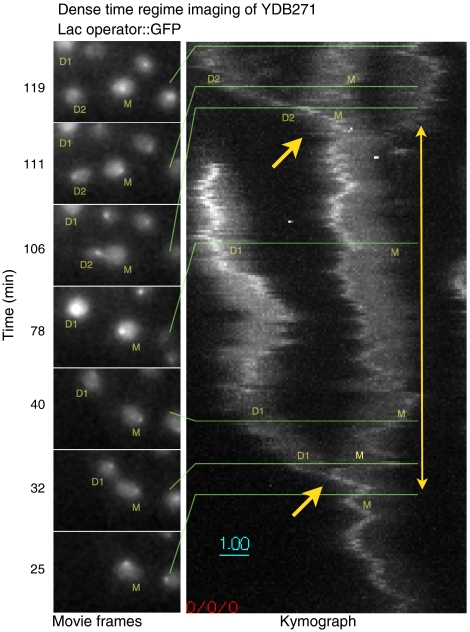
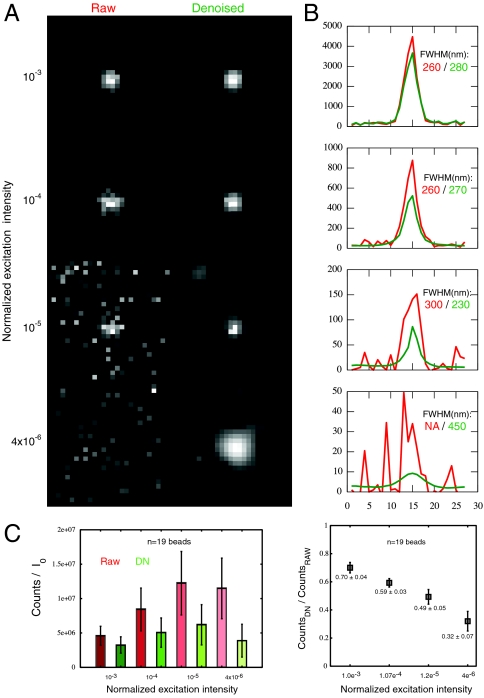
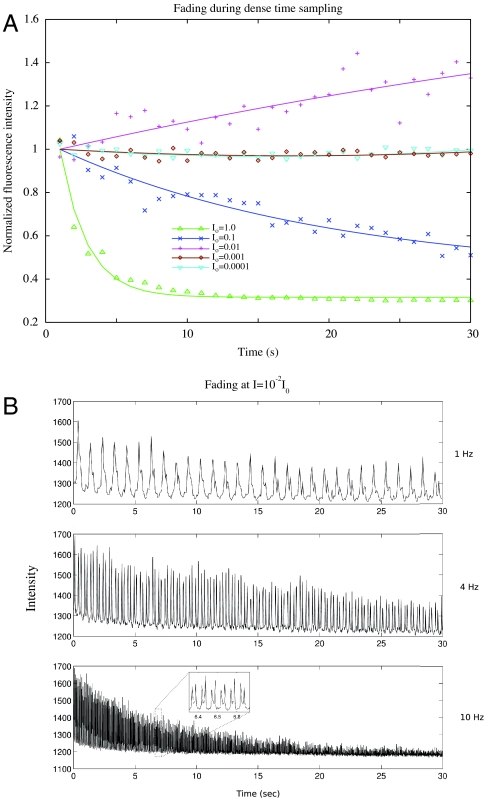
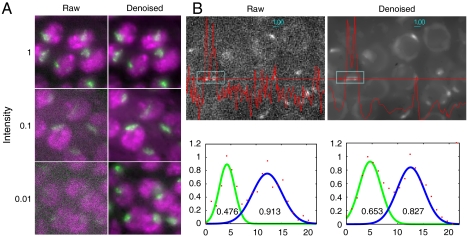
Live fluorescence microscopy has the unique capability to probe dynamic processes, linking molecular components and their localization with function. A key goal of microscopy is to increase spatial and temporal resolution while simultaneously permitting identification of multiple specific components. We demonstrate a new microscope platform, OMX, that enables subsecond, multicolor four-dimensional data acquisition and also provides access to subdiffraction structured illumination imaging. Using this platform to image chromosome movement during a complete yeast cell cycle at one 3D image stack per second reveals an unexpected degree of photosensitivity of fluorophore-containing cells. To avoid perturbation of cell division, excitation levels had to be attenuated between 100 and 10,000× below the level normally used for imaging. We show that an image denoising algorithm that exploits redundancy in the image sequence over space and time allows recovery of biological information from the low light level noisy images while maintaining full cell viability with no fading.


Conflict of interest statement

The authors declare no conflict of interest.

Figures

Fig. 1.
Fig. 1.
Overview of imaging conditions used in this study. (A) Sparse, dense, and fast time domain sampling regimes are shown to scale. (B) Power landscape showing the measured values of light intensity at the back focal plane for various attenuation values. Over 6 orders of magnitude of attenuation are possible. High-intensity light used for FRAP is shown at top right.
Fig. 2.
Fig. 2.
Viability measured 20 h after imaging in the sparse sampling regime. The number of cell doublings observed during a 20 h period as a function of excitation light intensity for the 20 min of imaging are shown. Normalized intensity values of 1 or 0.1 lead to decreased viability, whereas attenuation to 0.01 or below does not affect viability at this sampling regime.
Fig. 3.
Fig. 3.
Denoising increases the signal-to-noise of low-light images. Single yeast cells are imaged at varying excitation intensities (Left); each row contains a different cell. Average projections of raw images are at left, and the projections of the denoised versions of the same images are at right. Intensity line profiles drawn through the images where indicated (yellow lines) are plotted at right. Profiles are superimposed in the graphs showing the number of counts (red = raw, green = denoised), and compared side-by-side in the zoomed profiles at far right. Zoomed profiles display the intensity of 35 pixels surrounding the center point, normalized to the same height for each profile.
Fig. 4.
Fig. 4.
Diagram of the denoising procedure. (A) Illustration two-dimensional of N × N pixel patches used for comparisons. The center patch (green) is compared with all other same-sized patches (orange) within a certain neighborhood size (yellow). (B) Extension of this concept into three or four dimensions: patches at a given timepoint (green cube) are compared to other patches of the same size in the same and adjacent timepoints (orange), still within a certain neighborhood size (yellow).
Fig. 7.
Fig. 7.
At low light levels (I = 5 × 10-4I0), dense-regime imaging can continue for 2 h, encompassing a whole cell cycle, without fading or loss of viability. The entire series is shown in the SI Text. At left, individual frames from the 2 h imaging sequence, centered on the original cell, are shown proceeding in time from bottom to top. YDB271 yeast cells are labeled M (original mother cell), D1 (first daughter cell), and D2 (second daughter cell). Right, a kymograph created by averaging the 3D stacks in 30 s groups, then projecting the maximum intensity of the time-averaged 3D stacks first along the Z axis, then along the Y axis. Cell divisions are indicated by single arrows; the two-headed arrow delimits an entire cell cycle of the mother cell.
Fig. 5.
Fig. 5.
Quantitation of denoising effects on low-light images of fluorescent latex beads. (A) The same bead is measured in 3D at four different excitation intensities (10-3I0, 10-4I0, 10-5I0, and 4 × 10-6I0). Single Z sections through the 3D stack are shown and analyzed. The raw images (Left) lose signal-to-noise as excitation intensity decreases, whereas this is mostly recovered in the denoised images (Right). (B) Line profiles through the beads demonstrate overall maintenance of peak width measured by Gaussian fitting, until the noisiest condition (bottom), in which the raw image does not give a fit at all, and the denoised image shows peak broadening. (C) Peak intensities corrected for excitation intensity display sensitivity to signal-to-noise ratio. A field of fluorescent beads was imaged 60 times, subjected to denoising, and both raw and denoised images were time-averaged to enable comparisons. (Left) Excitation-corrected raw peak intensities increase as excitation decreases, whereas denoised peak intensities are more stable. Error bars show variation (± 1 standard deviation) in individual bead intensities. (Right) Ratios of denoised to raw peak intensities are plotted as mean ± standard deviation (n = 19 fluorescent beads).
Fig. 6.
Fig. 6.
Fading plots of Lac repressor::GFP foci during dense time sampling. (Upper) Yeast cells are imaged at five successively lower excitation levels, and peak intensities in each 3D stack, normalized to the intensity at the first timepoint, are plotted as a function of time. Photobleaching is visible at both I = I0 and I = 10-1I0. At I = 10-2I0, intensity is seen to increase, which may be due to weak photoactivation of GFP. Lower intensities remain flat for the entire 30s of imaging. (Lower) Fading increases at a given intensity level (I = 10-2I0) as the rate of imaging increases. In total, the samples receive 3.9 s of excitation at 1 Hz, 12 s of excitation at 4 Hz, and 23.7 s of excitation at 10 Hz.
Fig. 8.
Fig. 8.
Denoising applied to more complex images. (A) Larval nuclei of Drosophila melanogaster imaged simultaneously in two wavelengths. All chromosomes are labeled with a histone H2AvD::RFP fusion (shown in magenta), and the euchromatic half of the X chromosome is labeled with a GFP::MSL3 fusion (shown in green). The demarcation between the two signals is retained to a much greater degree in the denoised series, compared to the raw images. (B) Meiotic nuclei of C. elegans containing a GFP fusion to ZYG12, localizing to the outer nuclear envelope and to patches at the pairing center ends of chromosomes. Denoising results in a smoother line profile (red line) and clear demarcation of nuclear boundaries. Profiles of the two ZYG12::GFP patches in the inset box are fit to Gaussian distributions (Lower); numbers within the graphs display the full width at half maximum intensity.

Comment in

References

    1. Pawley JB. Handbook of Biological Confocal Microscopy. 2nd Ed. New York: Plenum; 2006.
    1. Jamieson DJ. Oxidative stress responses of the yeast Saccharomyces cerevisiae. Yeast. 1998;14:1511–1527. - PubMed
    1. Straight AF, et al. GFP tagging of budding yeast chromosomes reveals that protein–protein interactions can mediate sister chromatid cohesion. Curr Biol. 1996;6:1599–1608. - PubMed
    1. Weinert TA, Hartwell LH. The RAD9 gene controls the cell cycle response to DNA damage in Saccharomyces cerevisiae. Science. 1988;241:317–322. - PubMed
    1. Boulanger J, Kervrann C, Bouthemy P. Space-time adaptation for patch-based image sequence restoration. IEEE T Pattern Anal. 2007;29:1096–1102. - PubMed

Publication types