

doi: 10.1109/MSP.2010.936725.
Canonical Correlation Analysis for Data Fusion and Group Inferences: Examining applications of medical imaging data
- PMID: 20706554
- PMCID: PMC2919827
- DOI: 10.1109/MSP.2010.936725
Item in Clipboard
Canonical Correlation Analysis for Data Fusion and Group Inferences: Examining applications of medical imaging data
IEEE Signal Process Mag.
2010.
No abstract available
Figures

Generative models for fusion and source separation are shown in (a) and (b). To avoid overfitting, typically dimension reduced data matrices are used instead of the original high-dimensioned data X, X1, and X2 For data fusion, the spatial or temporal dimension is reduced. For group analysis, the temporal dimension is reduced.

Implementation steps for CCA-based fusion.
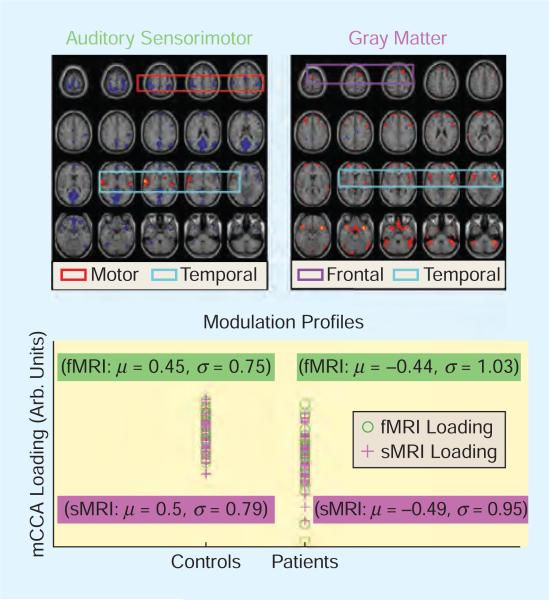
The fMRI component, sMRI component, and scatter plots of profiles for pair of components identified by CCA as maximally correlated. The profiles for both fMRI and sMRI are significantly different (α ≤ 0.05) between patients and controls. Patients with schizophrenia show more functional activity in motor areas and less activity in temporal areas associated with less gray matter as compared to healthy controls. The activation maps are scaled to Z values and thresholded at Z = 3.5.

Joint components estimated by jICA corresponding to common profile demonstrating significant difference between patients and controls. The activation maps are scaled to Z values and thresholded at Z = 3.5.

Data model for fusion of brain structure and function.

Set of associated components estimated by M-CCA that showed significantly different loading for patients versus controls.
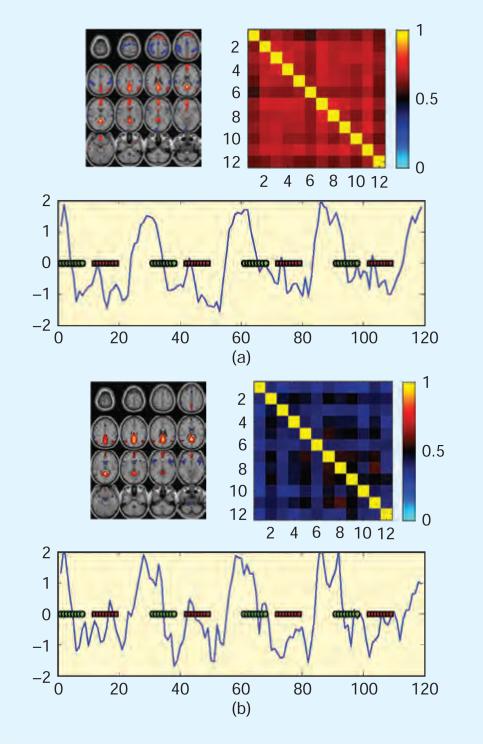
Estimated mean activation maps (top left), source correlation between subjects (top), and time course (bottom) of the default mode by (a) M-CCA and (b) group ICA. The right (green circle) and left (red block) visuomotor task paradigm is overlaid onto the estimated time courses for reference.
References
-
- Hotelling H. Relations between two sets of variates. Biometrika. 1936;28:321–377. <AU: Kindly provide the issue number.>.
-
- Kettenring J. Canonical analysis of several sets of variables. Biometrika. 1971;58:433–451. <AU: Kindly provide the issue number.>.
-
- Friston K, Jezzard P, Turner R. Analysis of functional MRI time-series. Hum. Brain Mapp. 1994;1:153–171. <AU: Kindly provide the issue number.>.
-
- Calhoun VD, Adali T. Unmixing fMRI with independent component analysis. IEEE Eng. Med. Biol. Mag. 2006 Mar./Apr.25(2):79–90. - PubMed
Grants and funding
LinkOut - more resources
Full Text Sources
Other Literature Sources