. 2010 Aug 10;5(8):e12057.
doi: 10.1371/journal.pone.0012057.

Ketogenic essential amino acids modulate lipid synthetic pathways and prevent hepatic steatosis in mice

Affiliations

Ketogenic essential amino acids modulate lipid synthetic pathways and prevent hepatic steatosis in mice

Yasushi Noguchi et al. PLoS One. .

Abstract

Background: Although dietary ketogenic essential amino acid (KAA) content modifies accumulation of hepatic lipids, the molecular interactions between KAAs and lipid metabolism are yet to be fully elucidated.

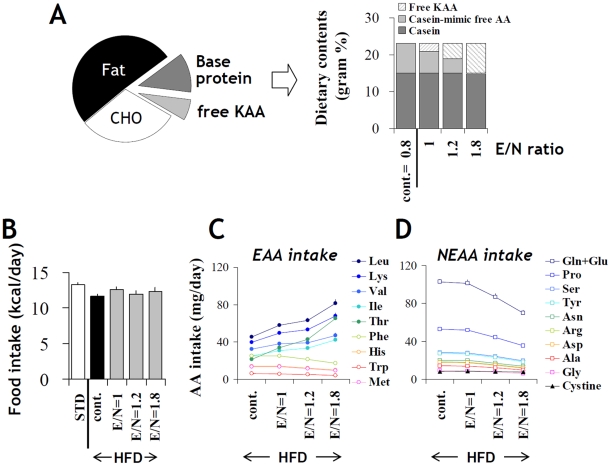
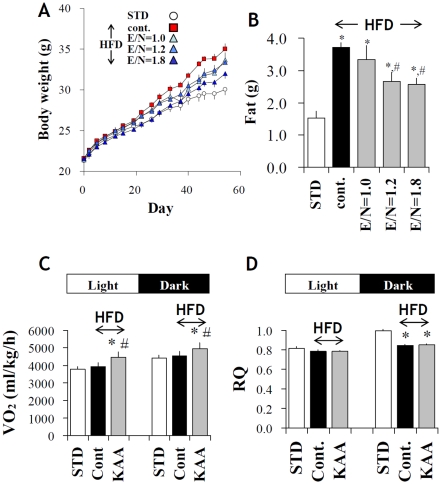
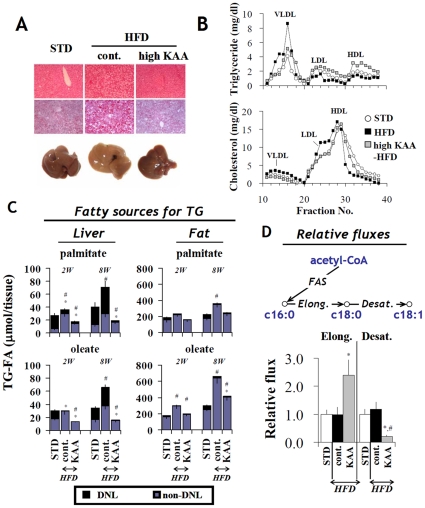
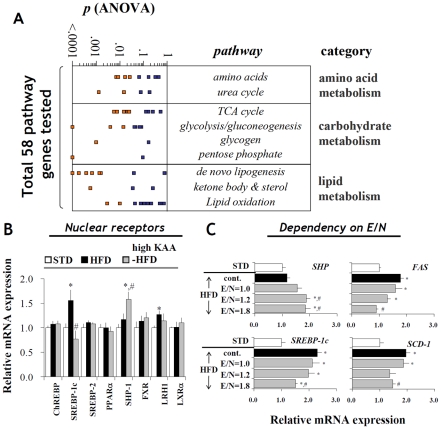
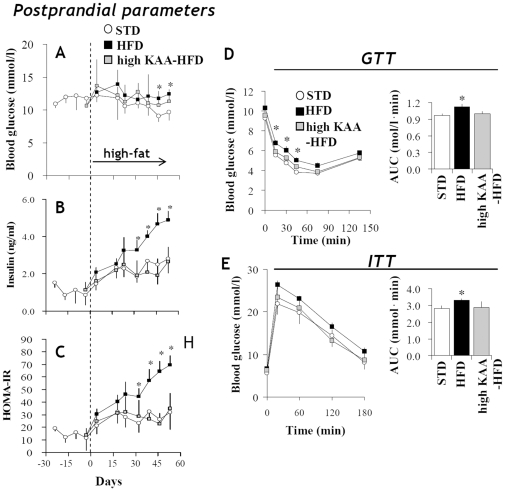
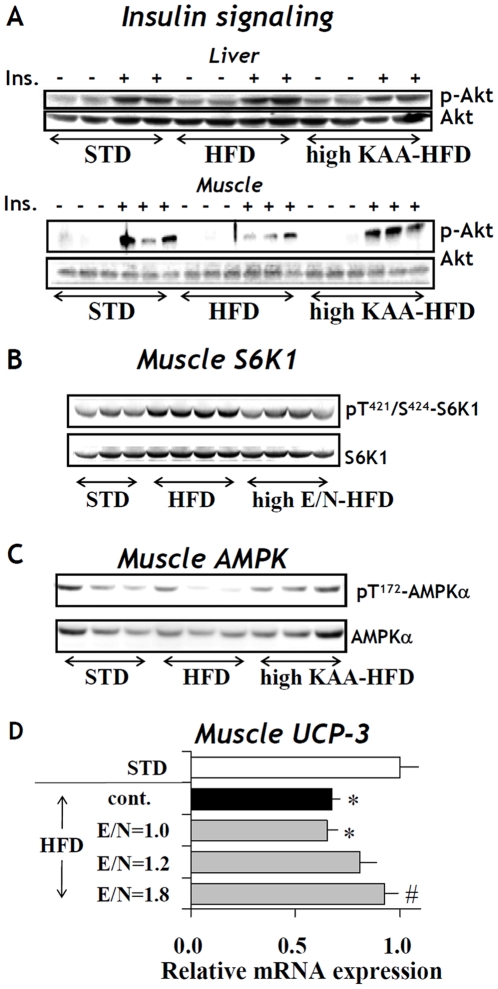
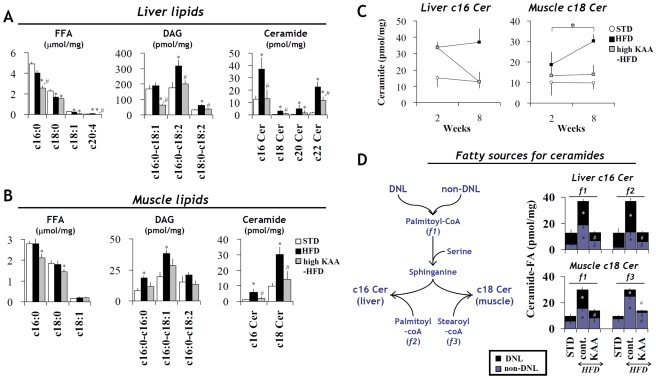
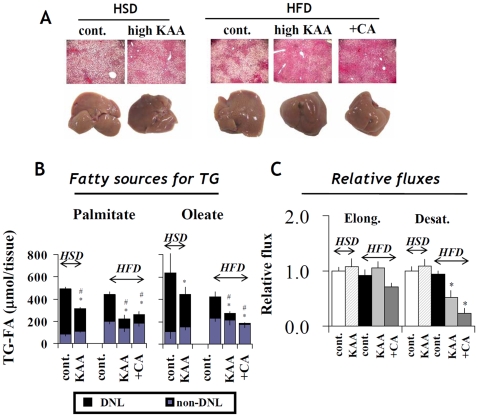
Methodology/principal findings: We designed a diet with a high ratio (E/N) of essential amino acids (EAAs) to non-EAAs by partially replacing dietary protein with 5 major free KAAs (Leu, Ile, Val, Lys and Thr) without altering carbohydrate and fat content. This high-KAA diet was assessed for its preventive effects on diet-induced hepatic steatosis and whole-animal insulin resistance. C57B6 mice were fed with a high-fat diet, and hyperinsulinemic ob/ob mice were fed with a high-fat or high-sucrose diet. The high-KAA diet improved hepatic steatosis with decreased de novo lipogenesis (DNL) fluxes as well as reduced expressions of lipogenic genes. In C57B6 mice, the high-KAA diet lowered postprandial insulin secretion and improved glucose tolerance, in association with restored expression of muscle insulin signaling proteins repressed by the high-fat diet. Lipotoxic metabolites and their synthetic fluxes were also evaluated with reference to insulin resistance. The high-KAA diet lowered muscle and liver ceramides, both by reducing dietary lipid incorporation into muscular ceramides and preventing incorporation of DNL-derived fatty acids into hepatic ceramides.

Conclusion: Our results indicate that dietary KAA intake improves hepatic steatosis and insulin resistance by modulating lipid synthetic pathways.


Conflict of interest statement

Competing Interests: The authors have declared that no competing interests exist.

Figures

Figure 1
Figure 1. Summary of dietary ketogenic amino acid manipulation.
(A) High ketogenic amino acid (KAA) diets were prepared by replacing dietary protein with a free KAA mixture of leucine, lysine, isoleucine, valine and threonine (for 1.8 E/N-ratio diet) or KAA plus casein-mimic free amino acid mixture (for 1 and 1.2 E/N-ratio diets). (B) Food intake by C57B6 mice was calculated on the basis of mean energy consumption (kcal/day) throughout an 8-week experimental period. Daily intake (mean+/−SEM, n = 9 for each group) of essential amino acids (EAA) (C) and non-EAA (NEAA) (D) in mice fed a high-fat diet with varied ratios of E/N (Table S1) were calculated based on daily food intake and amino acid composition of each diet. The five major KAA supplemented to the high E/N diets are distinguished by closed symbols.
Figure 2
Figure 2. Effects of high KAA diets on high-fat induced alterations.
Growth curves (A), fat (subcutaneous, epididymal and perinephric) weights (B), oxygen consumption (C), and respiratory quotient (D) of C57B6 mice fed for 8 weeks with varying E/N ratios due to KAA fortification (mean+/−SEM, n = 9 for each group). For oxygen consumption and respiratory quotient, mean values were obtained over 3 days following a week of acclimatization to the metabolic chamber, and only the results from the highest KAA diet (E/N = 1.8) are separately presented in the light and dark phase. *: p<0.05 for all the HFD control groups as compared to STD group; #: p<0.05 for all the high KAA (high E/N) groups as compared to HFD control.
Figure 3
Figure 3. Prevention of high-fat induced hepatic steatosis by high-KAA diet.
Samples were obtained from C57B6 mice fed for 2 or 8 weeks with STD, HFD or high-KAA HFD (E/N = 1.8). (A) Liver histology of hematoxylin-eosin staining (top) and oil red O staining (middle), and macroscopic appearances (bottom). (B) FPLC analyses of frozen plasma triglycerides (top) and cholesterol (bottom). Fractions 15–19: very low density lipoprotein (VLDL) and chylomicrons; fractions 20–26: intermediate density lipoproteins, low density lipoprotein (LDL), and large high density lipoprotein; fractions 27–33: high density lipoprotein (HDL). (C, D) Metabolic fluxes of de novo lipogenesis (DNL) pathways were analyzed by identifying fatty sources for hepatic triglycerides (C) and estimating the in vivo relative contributions of fatty acid synthase (FAS), elongase and desaturase fluxes using deuterated water labeling and mass isotopomer distribution analysis (D) (see Materials and Methods). The contribution of DNL to total triglyceride-fatty acids (TG-FA) in the liver (C, left) or epididymal fat tissue (C, right) was separately estimated for palmitate (c16:0) and oleate (c18:1). Black and blue bars represent DNL- and non-DNL sources, respectively. The contributions of elongase and desaturase (D) were assessed by DNLc18:0/DNLc16:0 and DNLc18:1/DNLc18:0, respectively. All values are expressed as mean+/−SEM (n = 6). In panel C, p<0.05 of DNL-derived FA and total FA compared to STD are indicated as * and #, respectively. In panel D, *: p<0.05 for all high-fat groups as compared to STD group; #: p<0.05 for the high-KAA group as compared to HFD control.
Figure 4
Figure 4. Changes in expression profiles of hepatic metabolic genes and regulators under different dietary conditions.
Samples were obtained from C57B6 mice (n = 9 for each group) fed for 8 weeks with STD, HFD or high-KAA (high E/N) HFD. (A) Diet-dependent changes in expressions of 70 hepatic genes (Table S6) involved in different metabolic pathways were assessed by ANOVA probability. Orange squares represent genes having significantly different expression levels (p<0.05) among 3 different diets (HFD, STD, and HFD plus KAA (E/N = 1.8)). Relative gene expression levels (STD = 1, normalized with 18S ribosomal RNA) of representative transcription factors and nuclear receptors (B), and fatty acid synthase (FAS), stearoyl-CoA desaturase 1 (SCD1), SREBP-1c and SHP under different dietary conditions (C). All values are expressed as mean+/−SEM. *: p<0.05 for all high-fat groups as compared to STD group; #: p<0.05 for the high-KAA (high-E/N) groups as compared to HFD control.
Figure 5
Figure 5. Attenuation of high-fat induced insulin resistance by dietary KAA.
Plasma glucose (A), insulin (B) and calculated indices of HOMA-IR (C) in C57B6 mice 4 weeks before and 8 weeks after feeding with STD, HFD or high-E/N HFD (E/N = 1.8), under 3-hour fasting condition. Using C57B6 mice (n = 6 for each group) fed for 8 weeks with STD, HFD or the high-KAA (high E/N) diet (E/N = 1.8), glucose tolerance tests (GTT) (D), or insulin tolerance tests (ITT) (E) were performed by intraperitoneal glucose or insulin administration (at time = 0) after overnight fasting. *: p<0.05 for all high-fat groups as compared to STD group.
Figure 6
Figure 6. Dietary effects on phosphorylation and expression of metabolic regulatory proteins in muscle and liver.
Samples were obtained from C57B6 mice (n = 3 for each group) fed for 12 weeks with STD, HFD or the high-KAA HFD (E/N = 1.8) except for (D), where mice were fed with the control HFD (cont.) or with HFD under varying E/N ratios. Total and phosphorylated Akt (p-Akt; Ser473) in the liver and muscle (A), S6K1 or S6K1-Thr421/Ser424 in the soleus muscle (B), and total and phosphorylated muscle AMPKα (C) were analyzed by Western blot. (D) Gene expression of UCP-3 in the soleus muscle was quantified by RT-PCR. Values are expressed as mean+/−SEM (n = 9). Symbols in (D) signify significant difference (p<0.05) for the comparison with STD (*) or control HFD (#).
Figure 7
Figure 7. Effect of high-KAA diet on the production of hepatic and muscular lipotoxic metabolites.
Samples were obtained from C57B6 mice (n = 6 for each group) fed for 8 weeks with STD, HFD or the high KAA HFD (E/N = 1.8), except for (C) where mice were sampled at 2 weeks in addition to 8 weeks. Lipid species of free fatty acids (FFA), diacylglycerols (DAG) and ceramides (Cer) in the liver (A) and gastrocnemius muscle (B) were quantified using GC-MS, where c16 Cer, c18 Cer, c20 Cer and c22 Cer correspond to palmitoyl-ceramide, stearoyl-ceramide, arachidyl-ceramide and docosanoyl-ceramide, respectively. Changes in liver c16 Cer and muscle c18 Cer concentrations were tracked between 2- and 8-week feeding periods (C). Metabolic pathway fluxes of hepatic and muscular ceramides were assessed by quantifying the contributions from palmitoyl-CoA (f1, f2) and stearoyl-CoA (f3) (see D left). The contribution of DNL-derived FA to ceramide synthesis was evaluated based on deuterium labeling of sphingosine- and acyl-groups (D), whereas non-DNL derived FA is illustrated with a blue column on the bottom of each bar. All values are expressed as mean+/−SEM (n = 6). *: p<0.05 for all high-fat groups as compared to STD group; #: p<0.05 for the high-KAA group as compared to HFD control.
Figure 8
Figure 8. High dietary high KAA improves hepatic steatosis in hyperinsulinemic mouse model.
Samples were obtained from ob/ob mice (n = 6 for each group) fed for 2 weeks with either a high-sucrose diet (HSD), or HFD in the presence (high E/N) or absence (cont.) of KAA fortification (E/N = 1.8) or cholate (+CA), which was used as an anti-hepatic-steatosis control agent. (A) Liver histology of hematoxylin-eosin staining (top) and oil red O staining (middle), and macroscopic liver appearances (bottom). (B,C) Metabolic fluxes of DNL pathways were analyzed by identifying fatty sources for hepatic triglycerides and estimating the in vivo relative contributions of fatty acid synthase (FAS), elongase and desaturase using deuterated water labeling and mass isotopomer distribution analysis (see Materials and Methods and Figure 3D). The contributions of elongase and desaturase (C) were assessed by DNLc18:0/DNLc16:0 and DNLc18:1/DNLc18:0, respectively. All values are expressed as mean+/−SEM (n = 6). In panel B, p<0.05 for DNL-derived FA and total FA versus the control group are indicated as * and #, respectively. In panel C, p<0.05 versus the control group is indicated as *.

Similar articles

Cited by

References

    1. Tilg H, Kaser A. Treatment strategies in nonalcoholic fatty liver disease. Nat Clin Pract Gastroenterol Hepatol. 2005;2:148–155. - PubMed
    1. Sanyal AJ. Mechanisms of Disease: pathogenesis of nonalcoholic fatty liver disease. Nat Clin Pract Gastroenterol Hepatol. 2005;2:46–53. - PubMed
    1. Postic C, Girard J. Contribution of de novo fatty acid synthesis to hepatic steatosis and insulin resistance: lessons from genetically engineered mice. J Clin Invest. 2008;118:829–838. - PMC - PubMed
    1. Holland WL, Brozinick JT, Wang LP, Hawkins ED, Sargent KM, et al. Inhibition of ceramide synthesis ameliorates glucocorticoid-, saturated-fat-, and obesity-induced insulin resistance. Cell Metab. 2007;5:167–179. - PubMed
    1. Chibalin AV, Leng Y, Vieira E, Krook A, Bjornholm M, et al. Downregulation of diacylglycerol kinase delta contributes to hyperglycemia-induced insulin resistance. Cell. 2008;132:375–386. - PubMed

Publication types