. 2010:2010:690907.
doi: 10.1155/2010/690907. Epub 2010 Jul 26.

Peroxisome proliferator-activated receptors alpha, Beta, and gamma mRNA and protein expression in human fetal tissues

Affiliations

Peroxisome proliferator-activated receptors alpha, Beta, and gamma mRNA and protein expression in human fetal tissues

Barbara D Abbott et al. PPAR Res. 2010.

Erratum in

  • PPAR Res. 2010;2010:627284

Abstract

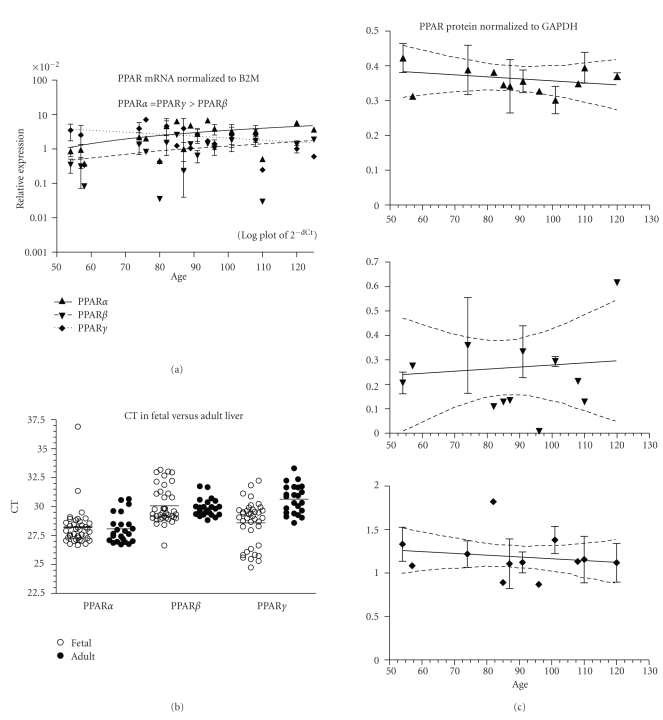
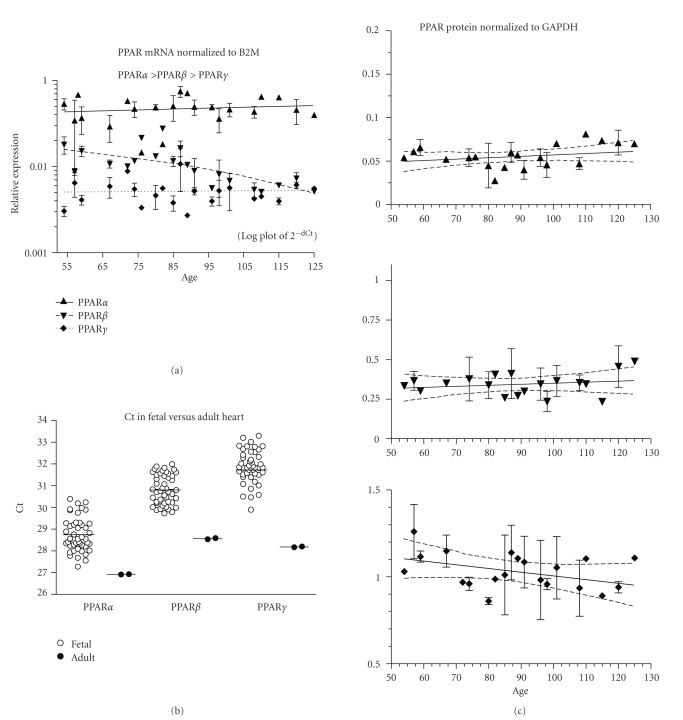
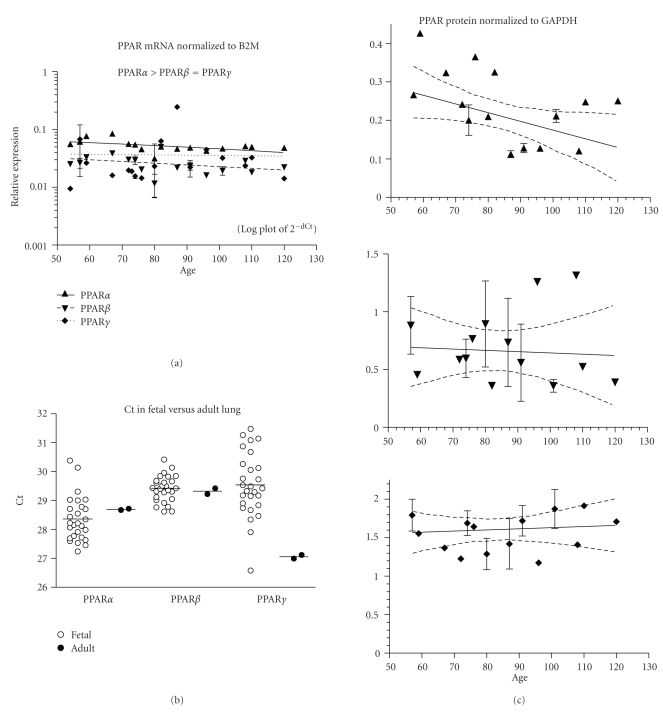
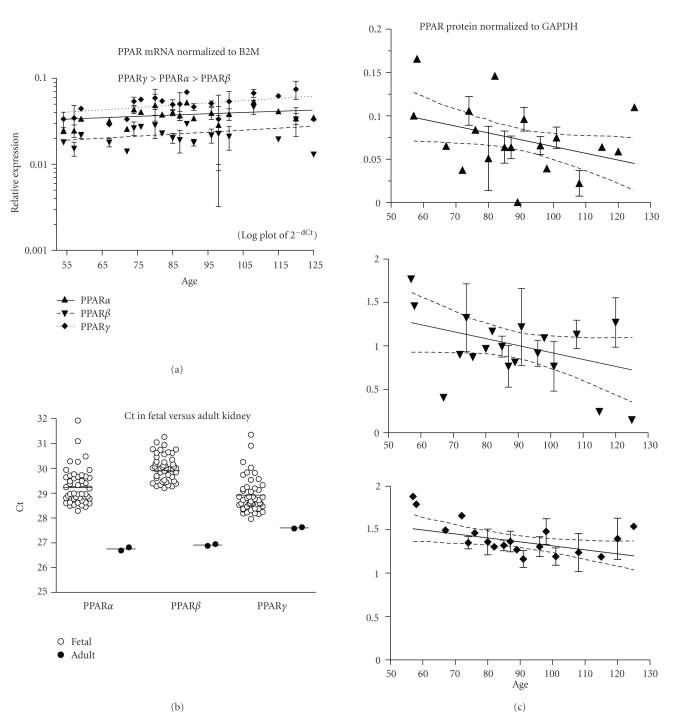
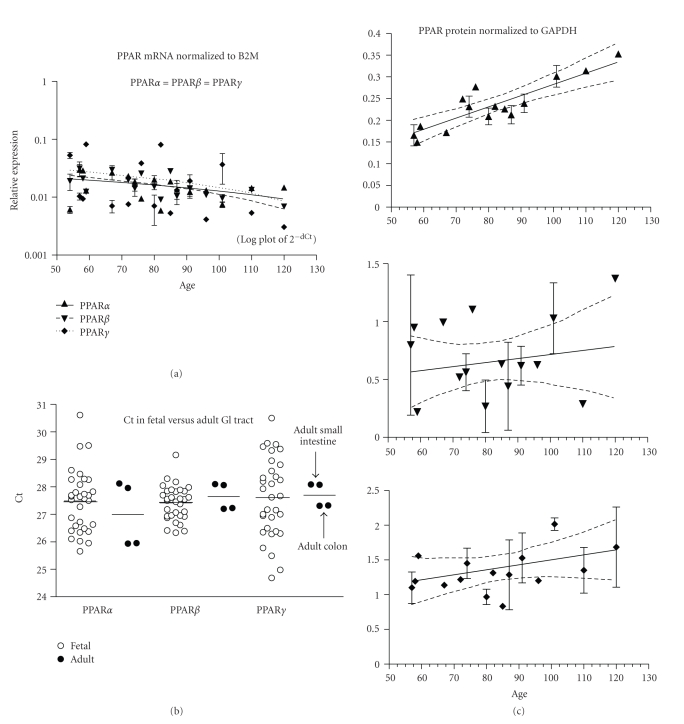
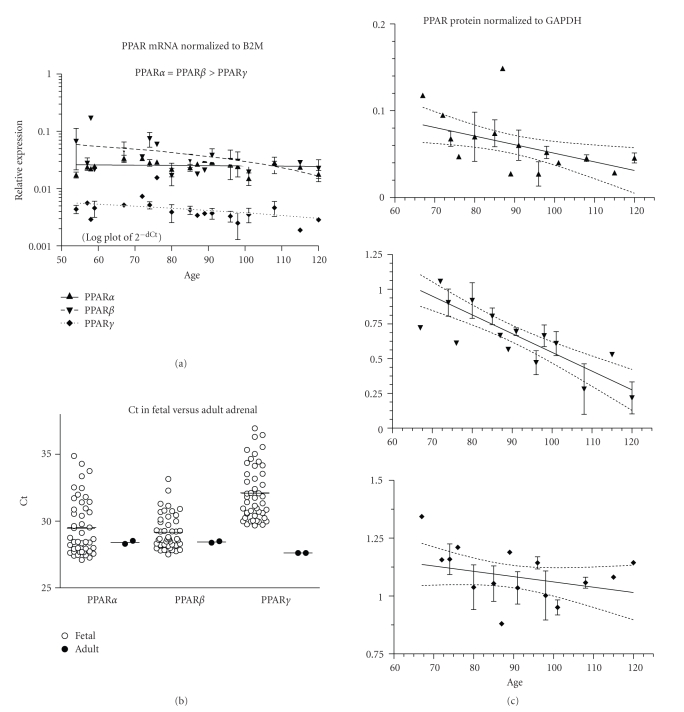
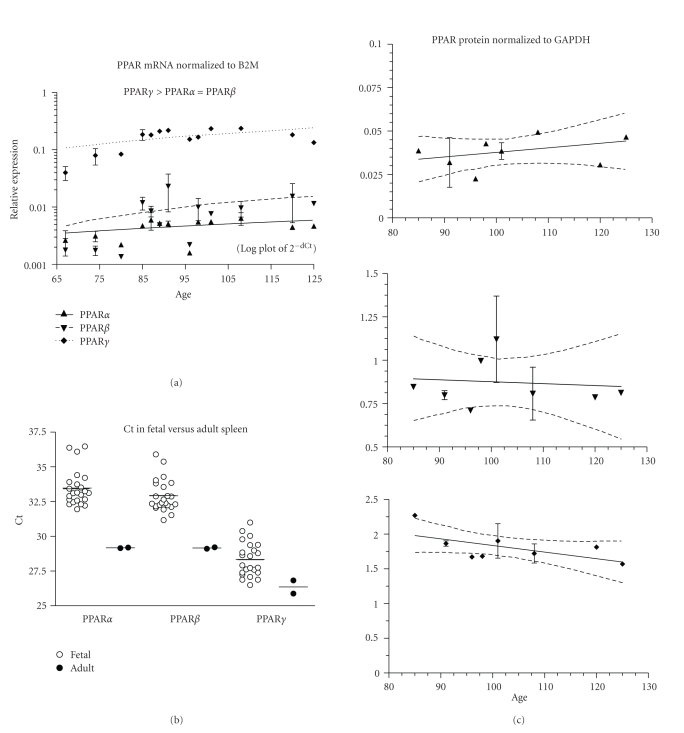
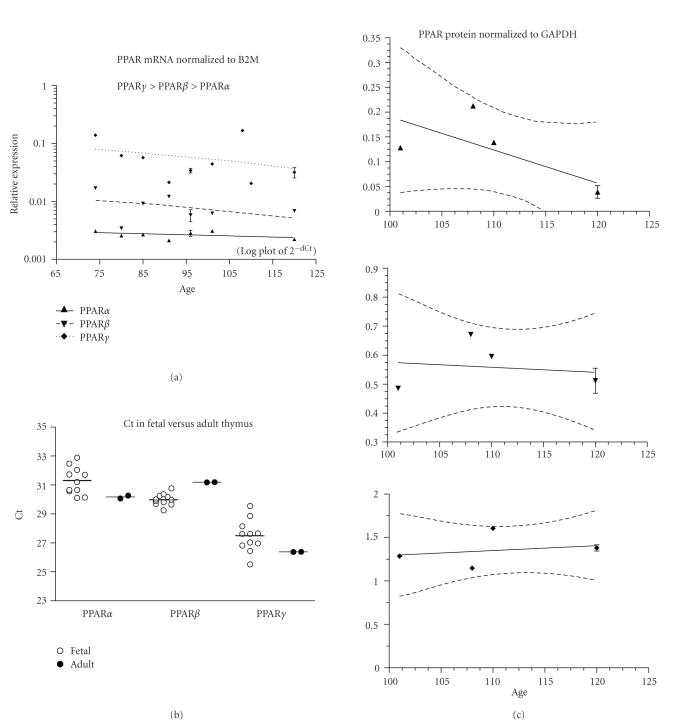
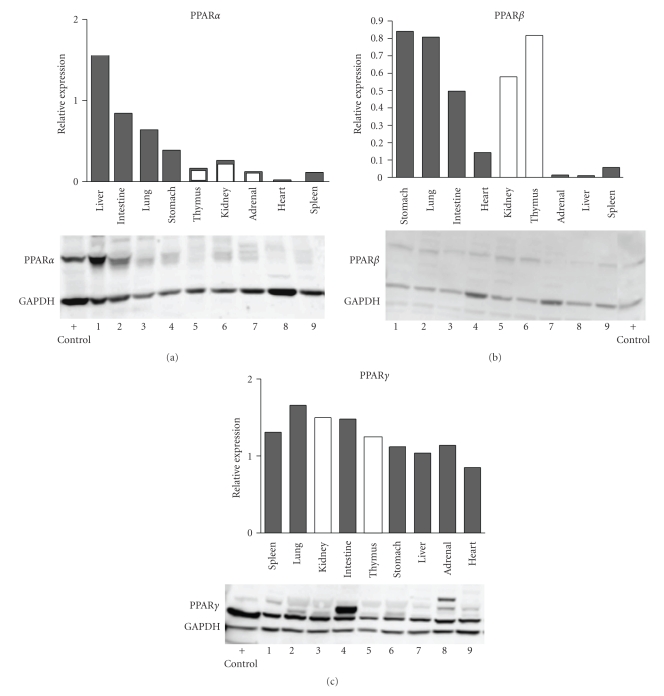
Peroxisome proliferator-activated receptors (PPARs) regulate lipid and glucose homeostasis, are targets of pharmaceuticals, and are also activated by environmental contaminants. Almost nothing is known about expression of PPARs during human fetal development. This study examines expression of PPARalpha, beta, and gamma mRNA and protein in human fetal tissues. With increasing fetal age, mRNA expression of PPARalpha and beta increased in liver, but PPARbeta decreased in heart and intestine, and PPARgamma decreased in adrenal. Adult and fetal mean expression of PPARalpha, beta, and gamma mRNA did not differ in intestine, but expression was lower in fetal stomach and heart. PPARalpha and beta mRNA in kidney and spleen, and PPARgamma mRNA in lung and adrenal were lower in fetal versus adult. PPARgamma in liver and PPARbeta mRNA in thymus were higher in fetal versus adult. PPARalpha protein increased with fetal age in intestine and decreased in lung, kidney, and adrenal. PPARbeta protein in adrenal and PPARgamma in kidney decreased with fetal age. This study provides new information on expression of PPAR subtypes during human development and will be important in evaluating the potential for the developing human to respond to PPAR environmental or pharmaceutical agonists.


Figures

Figure 1
Figure 1
Liver. (a) The expression of PPARα, β, and γ mRNA is shown across the fetal age range. Log plot of mean ± SEM Ct is normalized to β-2-microglobulin (B2M). (b) The fetal expression of PPARα, β, and γ is shown relative to expression in adult liver. Each symbol represents the mean Ct value of 2 replicates for each fetal (open circles) and adult (filled circles) sample (overall mean for each group is shown as a horizontal line). (c) PPARα, β, and γ protein expression is shown across the fetal age range. Western blot density is normalized to glyceraldehyde-3-phophate dehydrogenase (GAPDH). Up arrowhead indicates PPARα, down arrowhead PPARβ, and diamond PPARγ. If only one sample was available for a particular age, then an error term could not be calculated and no SEM bar is shown. Regression analysis evaluated change with age. Dashed lines in graphs of C are the 95% confidence interval.
Figure 2
Figure 2
Heart. (a) The expression of PPARα, β, and γ mRNA is shown across the fetal age range. Log plot of mean ± SEM Ct is normalized to β-2-microglobulin (B2M). (b) The fetal expression of PPARα, β, and γ is shown relative to expression in adult heart. Each symbol represents the mean Ct value of 2 replicates for each fetal (open circles) sample and adult (filled circles) individual replicates are shown (overall mean for each group is shown as a horizontal line). (c) PPARα, β, and γ protein expression is shown across the fetal age range. Western blot density normalized to glyceraldehyde-3-phophate dehydrogenase (GAPDH). Up arrowhead indicates PPARα, down arrowhead PPARβ, and diamond PPARγ. If only one sample was available for a particular age, then an error term could not be calculated and no SEM bar is shown. Regression analysis evaluated change with age. Dashed lines in graphs of C are the 95% confidence interval.
Figure 3
Figure 3
Lung. (a) The expression of PPARα, β, and γ mRNA is shown across the fetal age range. Log plot of mean ± SEM Ct is normalized to β-2-microglobulin (B2M). (b) The fetal expression of PPARα, β, and γ is shown relative to expression in adult lung. Each symbol represents the mean Ct value of 2 replicates for each fetal (open circles) sample and adult (filled circles) individual replicates are shown (overall mean for each group is shown as a horizontal line). (c) PPARα, β, and γ protein expression is shown across the fetal age range. Western blot density normalized to glyceraldehyde-3-phophate dehydrogenase (GAPDH). Up arrowhead indicates PPARα, down arrowhead PPARβ, and diamond PPARγ. If only one sample was available for a particular age, then an error term could not be calculated and no SEM bar is shown. Regression analysis evaluated change with age. Dashed lines in graphs of C are the 95% confidence interval.
Figure 4
Figure 4
Kidney. (a) The expression of PPARα, β, and γ mRNA is shown across the fetal age range. Log plot of mean ± SEM Ct is normalized to β-2-microglobulin (B2M). (b) The fetal expression of PPARα, β, and γ is shown relative to expression in adult kidney. Each symbol represents the mean Ct value of 2 replicates for each fetal (open circles) sample and adult (filled circles) individual replicates are shown (overall mean for each group is shown as a horizontal line). (c) PPARα, β, and γ protein expression is shown across the fetal age range. Western blot density normalized to glyceraldehyde-3-phophate dehydrogenase (GAPDH). Up arrowhead indicates PPARα, down arrowhead PPARβ, and diamond PPARγ. If only one sample was available for a particular age, then an error term could not be calculated and no SEM bar is shown. Regression analysis evaluated change with age. Dashed lines in graphs of C are the 95% confidence interval.
Figure 5
Figure 5
Stomach. (a) The expression of PPARα, β, and γ mRNA is shown across the fetal age range. Log plot of mean ± SEM Ct is normalized to β-2-microglobulin (B2M). (b) The fetal expression of PPARα, β, and γ is shown relative to expression in adult stomach. Each symbol represents the mean Ct value of 2 replicates for each fetal (open circles) sample and adult (filled circles) individual replicates are shown (overall mean for each group is shown as a horizontal line). (c) PPARα, β, and γ protein expression is shown across the fetal age range. Western blot density normalized to glyceraldehyde-3-phophate dehydrogenase (GAPDH). Up arrowhead indicates PPARα, down arrowhead PPARβ, and diamond PPARγ. If only one sample was available for a particular age, then an error term could not be calculated and no SEM bar is shown. Regression analysis evaluated change with age. Dashed lines in graphs of C are the 95% confidence interval.
Figure 6
Figure 6
Intestine. (a) The expression of PPARα, β, and γ mRNA is shown across the fetal age range. Log plot of mean ± SEM Ct is normalized to β-2-microglobulin (B2M). (b) The fetal expression of PPARα, β, and γ is shown relative to expression in adult small intestine and colon (filled circles show the 2 replicates of small intestine above and 2 replicates of colon below the line indicating the mean of the combined tissue values). Each open symbol represents the mean Ct value of 2 replicates for each fetal sample (overall mean is shown as a horizontal line). (c) PPARα, β, and γ protein expression is shown across the fetal age range. Western blot density is normalized to glyceraldehyde-3-phophate dehydrogenase (GAPDH). Up arrowhead indicates PPARα, down arrowhead PPARβ, and diamond PPARγ. If only one sample was available for a particular age, then an error term could not be calculated and no SEM bar is shown. Regression analysis evaluated change with age. Dashed lines in graphs of C are the 95% confidence interval.
Figure 7
Figure 7
Adrenal. (a) The expression of PPARα, β, and γ mRNA is shown across the fetal age range. Log plot of mean ± SEM Ct is normalized to β-2-microglobulin (B2M). (b) The fetal expression of PPARα, β, and γ is shown relative to expression in adult adrenal. Each symbol represents the mean Ct value of 2 replicates for each fetal (open circles) sample and adult (filled circles) individual replicates are shown (overall mean for each group is shown as a horizontal line). (c) PPARα, β, and γ protein expression is shown across the fetal age range. Western blot density is normalized to glyceraldehyde-3-phophate dehydrogenase (GAPDH). Up arrowhead indicates PPARα, down arrowhead PPARβ, and diamond PPARγ. If only one sample was available for a particular age, then an error term could not be calculated and no SEM bar is shown. Regression analysis evaluated change with age. Dashed lines in graphs of C are the 95% confidence interval.
Figure 8
Figure 8
Spleen. (a) The expression of PPARα, β, and γ mRNA is shown across the fetal age range. Log plot of mean ± SEM Ct is normalized to β-2-microglobulin (B2M). (b) The fetal expression of PPARα, β, and γ is shown relative to expression in adult spleen. Each symbol represents the mean Ct value of 2 replicates for each fetal (open circles) sample and adult (filled circles) individual replicates are shown (overall mean for each group is shown as a horizontal line). (c) PPARα, β, and γ protein expression is shown across the fetal age range. Western blot density is normalized to glyceraldehyde-3-phophate dehydrogenase (GAPDH). Up arrowhead indicates PPARα, and down arrowhead PPARβ, and diamond PPARγ. If only one sample was available for a particular age, then an error term could not be calculated and no SEM bar is shown. Regression analysis evaluated change with age. Dashed lines in graphs of C are the 95% confidence interval.
Figure 9
Figure 9
Thymus. (a) The expression of PPARα, β, and γ mRNA is shown across the fetal age range. Log plot of mean ± SEM Ct is normalized to β-2-microglobulin (B2M). (b) The fetal expression of PPARα, β, and γ is shown relative to expression in adult thymus. Each symbol represents the mean Ct value of 2 replicates for each fetal (open circles) sample and adult (filled circles) individual replicates are shown (overall mean for each group is shown as a horizontal line). (c) PPARα, β, and γ protein expression is shown across the fetal age range. Western blot density is normalized to glyceraldehyde-3-phophate dehydrogenase (GAPDH). Up arrowhead indicates PPARα, and down arrowhead PPARβ, and diamond PPARγ. If only one sample was available for a particular age, then an error term could not be calculated and no SEM bar is shown. Regression analysis evaluated change with age. Dashed lines in graphs of C are the 95% confidence interval.
Figure 10
Figure 10
Western blots are shown in which all 9 tissues are present on each blot. On the PPARα blot, all tissues shown by dark bars were from a single 91-day-old fetus, and adrenal and kidney (white bars) were from different 91-day-old fetuses, and thymus was from a 101-day-old fetus. The blots for PPARβ and PPARγ used samples from a 91-day-old fetus (dark bars, the same set of samples for both PPARβ and γ) with kidney and thymus samples (white bars) from different fetuses (91 and 108 days, resp.). Blot images are labeled to show the location of the PPAR band, the GAPDH band, and lane containing the positive control (Hep G2 whole cell extract, Jurkat cell nuclear extract, and U937 whole cell extract, for expression of PPARα, β, or γ, resp.). The densitometry data (PPAR expression normalized to GAPDH) for each gel is shown above the blot image. Lanes 1–9 contain the samples listed on the x-axis of the bar graphs.

Similar articles

Cited by

References

    1. Desvergne B, Wahli W. Peroxisome proliferator-activated receptors: nuclear control of metabolism. Endocrine Reviews. 1999;20(5):649–688. - PubMed
    1. Keller H, Devchand PR, Perroud M, Wahli W. PPARα structure-function relationships derived from species-specific differences in responsiveness to hypolipidemic agents. Biological Chemistry. 1997;378(7):651–655. - PubMed
    1. Michalik L, Desvergne B, Dreyer C, Gavillet M, Laurini RN, Wahli W. PPAR expression and function during vertebrate development. International Journal of Developmental Biology. 2002;46(1):105–114. - PubMed
    1. Escher P, Wahli W. Peroxisome proliferator-activated receptors: insight into multiple cellular functions. Mutation Research. 2000;448(2):121–138. - PubMed
    1. Barak Y, Kim S. Genetic manipulations of PPARs: effects on obesity and metabolic disease. PPAR Research. 2007;2007:12 pages. Article ID 12781. - PMC - PubMed

LinkOut - more resources