. 2010 Aug 13:11:473.
doi: 10.1186/1471-2164-11-473.

Genetic validation of whole-transcriptome sequencing for mapping expression affected by cis-regulatory variation

Affiliations

Genetic validation of whole-transcriptome sequencing for mapping expression affected by cis-regulatory variation

Tomas Babak et al. BMC Genomics. .

Abstract

Background: Identifying associations between genotypes and gene expression levels using microarrays has enabled systematic interrogation of regulatory variation underlying complex phenotypes. This approach has vast potential for functional characterization of disease states, but its prohibitive cost, given hundreds to thousands of individual samples from populations have to be genotyped and expression profiled, has limited its widespread application.

Results: Here we demonstrate that genomic regions with allele-specific expression (ASE) detected by sequencing cDNA are highly enriched for cis-acting expression quantitative trait loci (cis-eQTL) identified by profiling of 500 animals in parallel, with up to 90% agreement on the allele that is preferentially expressed. We also observed widespread noncoding and antisense ASE and identified several allele-specific alternative splicing variants.

Conclusion: Monitoring ASE by sequencing cDNA from as little as one sample is a practical alternative to expression genetics for mapping cis-acting variation that regulates RNA transcription and processing.


Figures

Figure 1
Figure 1
Reproducibility and tissue specificity of ASE measured with NSR-seq. (a) Observed and expected error in biological replicates. RNA was isolated from independent samples, and subjected to NSR-seq (see methods). The error was calculated as the difference in log2(allelic ratio) between the two replicates, and is shown in relation to the average number of reads for the SNP in the two replicates (left panel). As expected, SNPs with more reads show lower error. The theoretically expected errors from the binomial distribution (right panel). Simulated data was not significantly different than the real data, when comparing errors by the Wilcoxon test (p > 0.2). (b) Ratio of allele-specific sequencing reads between two biological replicates for RefSeq genes with at least 100 reads. R2 = 0.84 (n = 289, p = 2.4e-115) (c) ASE conservation of RefSeq genes between islets and adipose. log(binomial-p) reflects confidence of ASE, and was arbitrarily set to negative when bias was toward B6 allele. R2 = 0.20 (n = 887, p = 2.4e-115)
Figure 2
Figure 2
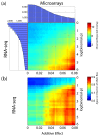
Genes mapped to cis-eQTL (Array) and genes under allele-specific expression (ASE; NSR-seq) overlap and agree on direction of allelic bias in adipose. (a) Ratio of observed to expected level of overlapping genes exceeding Genetic Additive Effect and ASE confidence scores. Histograms along the axes depict the number of genes exceeding Additive Effect or binomial-p thresholds. (b) Proportion of overlapping genes for which ASE and Additive Effect agree on direction of allelic bias (i.e. higher expression detected from B6 or BTBR allele by both approaches).
Figure 3
Figure 3
Visualization of allelic bias in NSR-seq data. (a) For each RefSeq transcript in adipose, the total number of informative reads was plotted against the difference in reads between alleles. The 99% confidence interval (from the binomial distribution) is shown in green, with points above the upper line or below the lower line falling outside the expected range for 99% of a random data set (lacking ASE). (b) The same as part (a), but showing SNPs that fall outside of RefSeq transcripts. These regions were not assayed on our microarrays, but still show pronounced ASE.
Figure 4
Figure 4
Antisense transcription from same allele is more common than antidirectional transcription from separate alleles. (a) Schematic distinguishing these two possibilities. (b) LBP scores of antisense expressed SNPs as a function of genomic strand. Points along positively sloping diagonal correspond to antisense expression from the same allele, points along negatively sloping diagonal (red diamonds) correspond to antidirectional allele-specific expression. Diamonds correspond to validated antidirectional events. (c) Validation of allele-specific antidirectional transcription of top four candidates (three of the SNPs are from same gene). In all cases, direction of bias agreed with NSR-seq. Genomic coordinates correspond to genome release NCBI build 36.

Similar articles

Cited by

References

    1. Gibson G, Weir B. The quantitative genetics of transcription. Trends Genet. 2005;21(11):616–623. - PubMed
    1. Chen Y, Zhu J, Lum PY, Yang X, Pinto S, MacNeil DJ, Zhang C, Lamb J, Edwards S, Sieberts SK. et al.Variations in DNA elucidate molecular networks that cause disease. Nature. 2008;452(7186):429–435. - PMC - PubMed
    1. Emilsson V, Thorleifsson G, Zhang B, Leonardson AS, Zink F, Zhu J, Carlson S, Helgason A, Walters GB, Gunnarsdottir S. et al.Genetics of gene expression and its effect on disease. Nature. 2008;452(7186):423–428. - PubMed
    1. Fraser HB, Xie X. Common polymorphic transcript variation in human disease. Genome Res. 2009;19(4):567–75. - PubMed
    1. Schadt EE, Molony C, Chudin E, Hao K, Yang X, Lum PY, Kasarskis A, Zhang B, Wang S, Suver C. et al.Mapping the genetic architecture of gene expression in human liver. PLoS Biol. 2008;6(5):e107. - PMC - PubMed

Substances

LinkOut - more resources