

Genome-wide association study identifies variants associated with histologic features of nonalcoholic Fatty liver disease
- PMID: 20708005
- PMCID: PMC2967576
- DOI: 10.1053/j.gastro.2010.07.057
Genome-wide association study identifies variants associated with histologic features of nonalcoholic Fatty liver disease
Abstract
Background & aims: Little data are available from genome-wide association studies (GWASs) of liver histology in patients with nonalcoholic fatty liver disease (NAFLD). We conducted a pilot GWAS in patients with NAFLD, characterized by histology, who were enrolled in the NASH Clinical Research Network (CRN) Database Study.
Methods: We studied clinical, laboratory, and histologic data from 236 non-Hispanic white women with NAFLD. We analyzed 324,623 single nucleotide polymorphisms (SNPs) from the 22 autosomal chromosomes. Multivariate-adjusted logistic regression analyses were conducted for binary outcomes, and linear regression analysis was applied for quantitative traits. A P value < 1 × 10(-6) was considered to be significant.
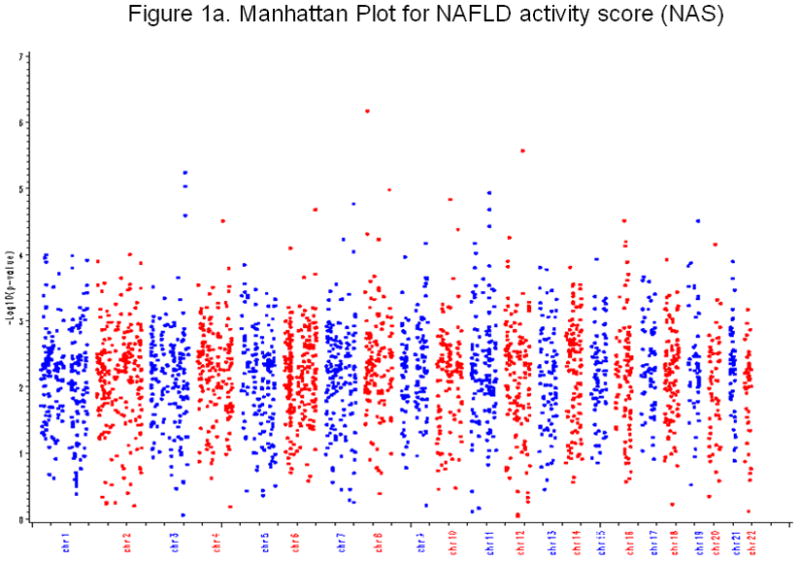
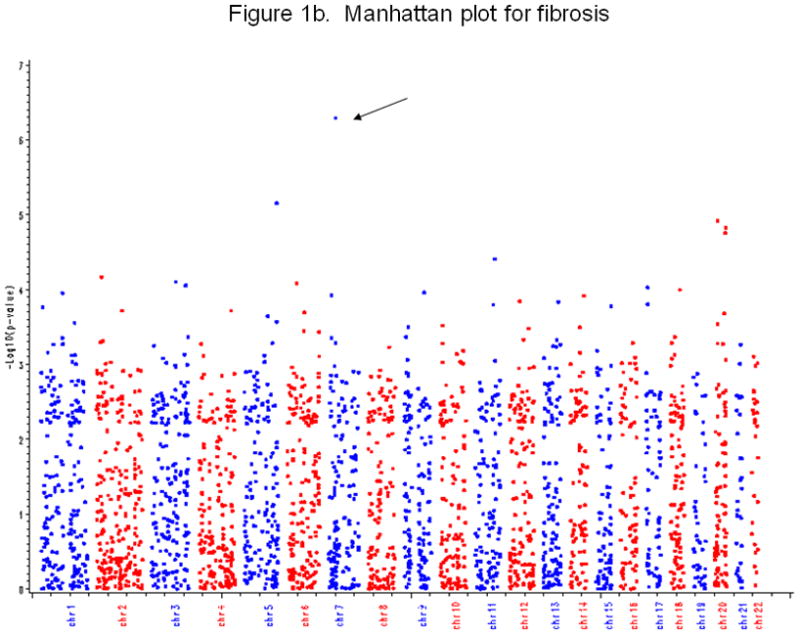
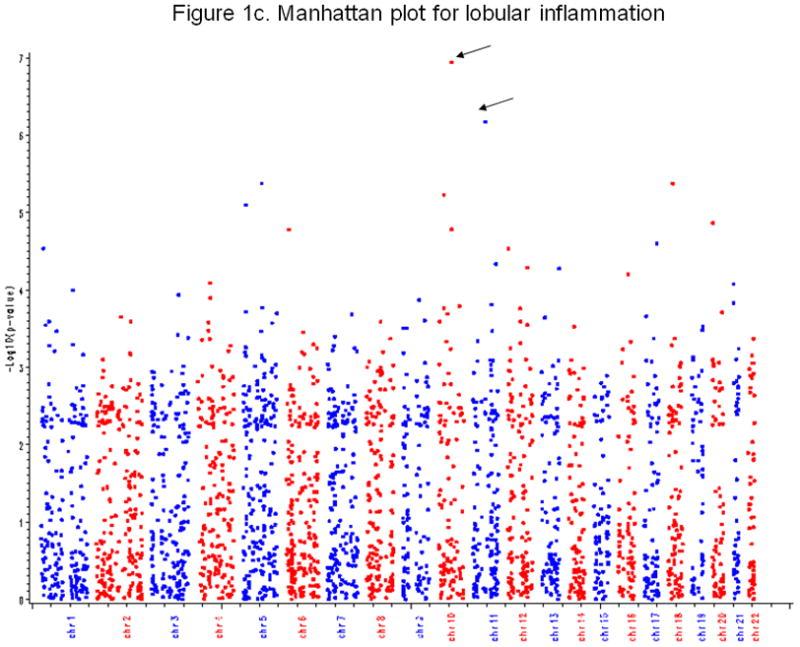
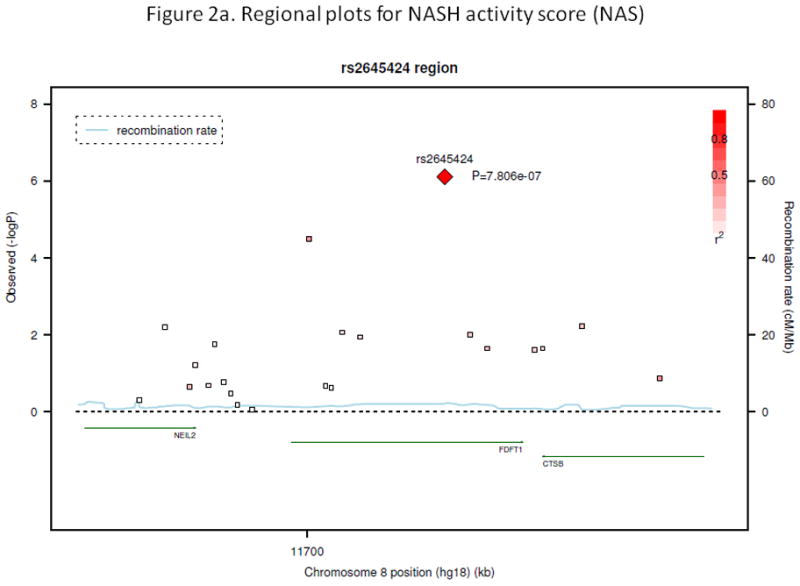
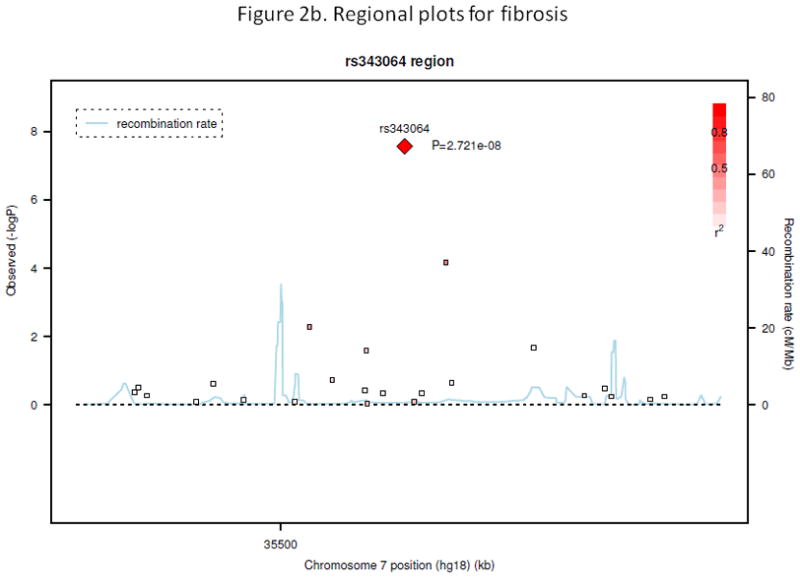
Results: In multivariate models adjusted for age, body mass index, diabetes, waist/hip ratios, and levels of glycated hemoglobin, the NAFLD activity score was associated with the SNP rs2645424 on chromosome 8 in farnesyl diphosphate farnesyl transferase 1 (FDFT1) (P = 6.8 × 10(-7)). The degree of fibrosis was associated with the SNP rs343062 on chromosome 7 (P = 2.7 × 10(-8)). SNPs associated with lobular inflammation included SNP rs1227756 on chromosome 10 in COL13A1 (P = 2.0 × 10(-7)), rs6591182 on chromosome 11 (P = 8.6 × 10(-7)), and rs887304 on chromosome 12 in EFCAB4B (P = 7.7 × 10(-7)). SNPs associated with serum levels of alanine aminotransferase included rs2499604 on chromosome 1 (P = 2.2 × 10(-6)), rs6487679 on chromosome 12 in PZP (P = 1.3 × 10(-6)), rs1421201 on chromosome 18 (P = 1.0 × 10(-5)), and rs2710833 on chromosome 4 (P = 6.3 × 10(-7)). No significant associations were observed between genotypes and steatosis, ballooning degeneration, portal inflammation, or other features of NAFLD.
Conclusions: A GWAS significantly associated genetic variants with features of hepatic histology in patients with NAFLD. These findings should be validated in larger and more diverse cohorts.
Copyright © 2010 AGA Institute. Published by Elsevier Inc. All rights reserved.
Figures
Comment in
-
Polymorphism in the farnesyl diphosphate farnesyl transferase 1 gene and nonalcoholic fatty liver disease severity.Gastroenterology. 2011 May;140(5):1694-5. doi: 10.1053/j.gastro.2011.01.060. Epub 2011 Mar 24. Gastroenterology. 2011. PMID: 21439984 No abstract available.
References
-
- Browning JD, Szczepaniak LS, Dobbins R, Nuremberg P, Horton JD, Cohen JC, Grundy SM, Hobbs HH. Prevalence of hepatic steatosis in an urban population in the United States: impact of ethnicity. Hepatology. 2004;40:1387–95. - PubMed
-
- Angulo P, Keach JC, Batts KP, Lindor KD. Independent predictors of liver fibrosis in patients with nonalcoholic steatohepatitis. Hepatology. 1999;30:1356–62. - PubMed
-
- Matteoni CA, Younossi ZM, Gramlich T, Boparai N, Liu YC, McCullough AJ. Nonalcoholic fatty liver disease: a spectrum of clinical and pathological severity. Gastroenterology. 1999;116:1413–9. - PubMed
-
- Abdelmalek MF, Liu C, Shuster J, Nelson DR, Asal NR. Familial aggregation of insulin resistance in first-degree relatives of patients with nonalcoholic fatty liver disease. Clin Gastroenterol Hepatol. 2006;4:1162–9. - PubMed
Publication types
MeSH terms
Substances
Grants and funding
- U01 DK061737/DK/NIDDK NIH HHS/United States
- R24 DK080506/DK/NIDDK NIH HHS/United States
- U01DK061737/DK/NIDDK NIH HHS/United States
- P30 DK063491/DK/NIDDK NIH HHS/United States
- U01 DK061730/DK/NIDDK NIH HHS/United States
- P30DK063491/DK/NIDDK NIH HHS/United States
- M01 RR000425/RR/NCRR NIH HHS/United States
- R01DK079888/DK/NIDDK NIH HHS/United States
- R01 DK079888/DK/NIDDK NIH HHS/United States
- DK080506/DK/NIDDK NIH HHS/United States
- M01-RR00425/RR/NCRR NIH HHS/United States
- K24 DK069290/DK/NIDDK NIH HHS/United States
- K24DK069290/DK/NIDDK NIH HHS/United States
LinkOut - more resources
Full Text Sources
Other Literature Sources
Medical
Miscellaneous
