. 2010 Aug 9;18(2):109-21.
doi: 10.1016/j.ccr.2010.06.018.

SIK2 is a centrosome kinase required for bipolar mitotic spindle formation that provides a potential target for therapy in ovarian cancer

Affiliations

SIK2 is a centrosome kinase required for bipolar mitotic spindle formation that provides a potential target for therapy in ovarian cancer

Ahmed Ashour Ahmed et al. Cancer Cell. .

Abstract

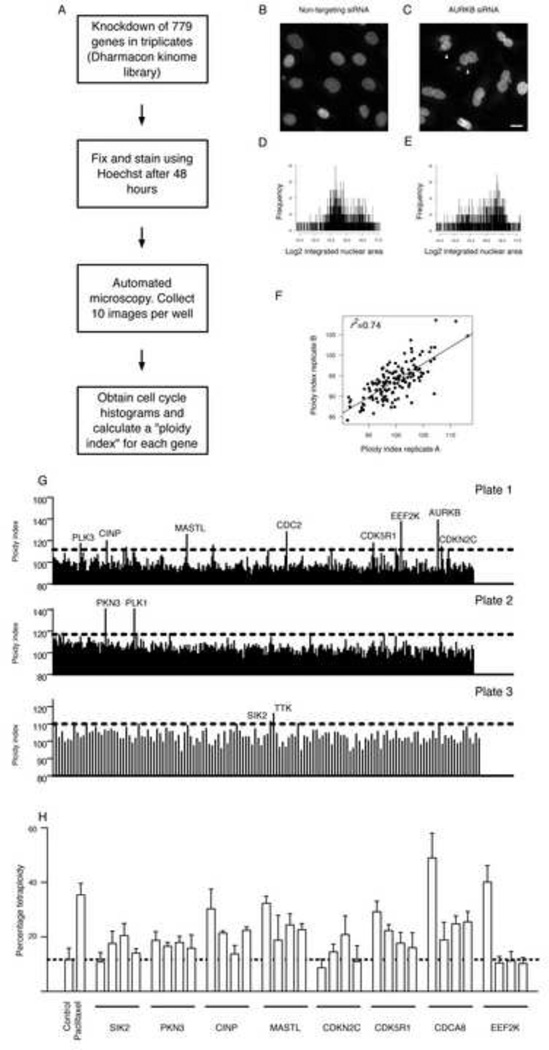
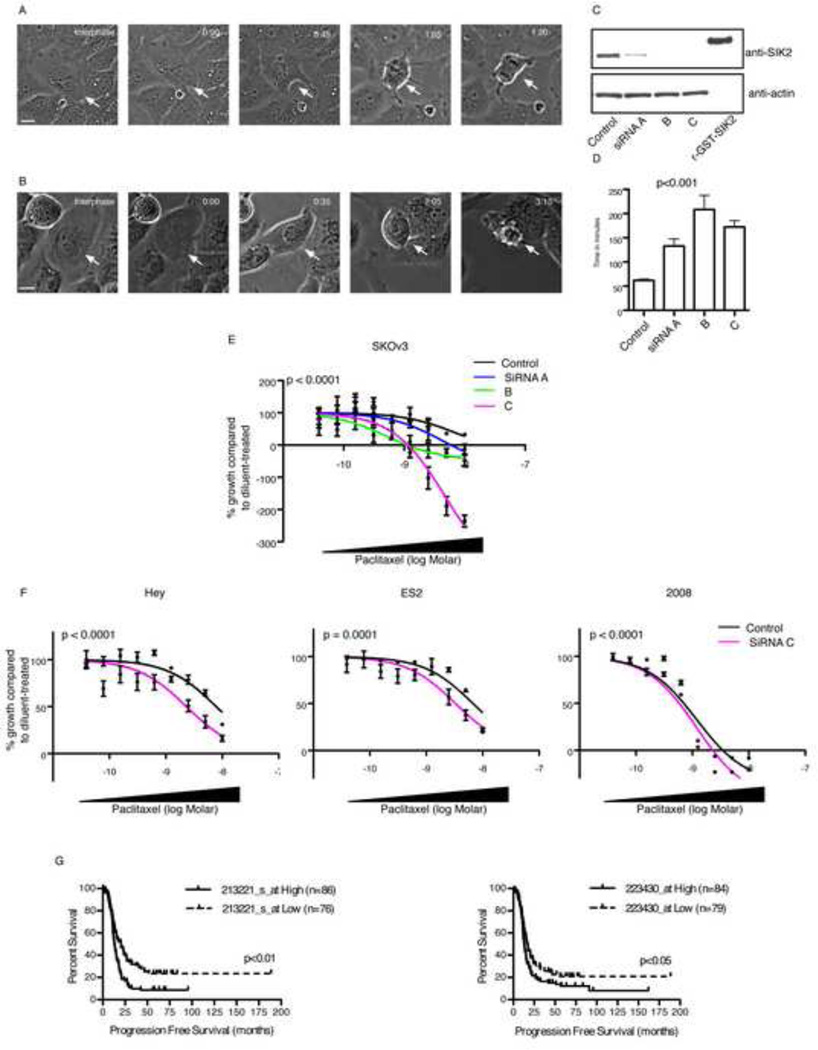
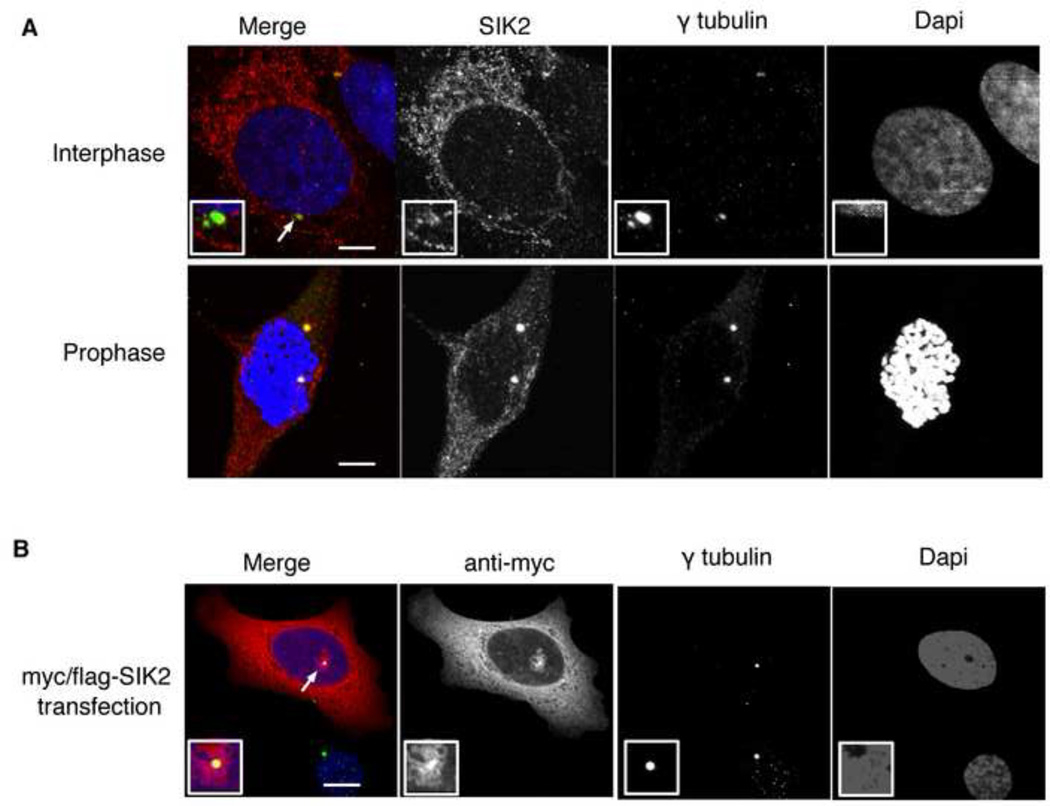
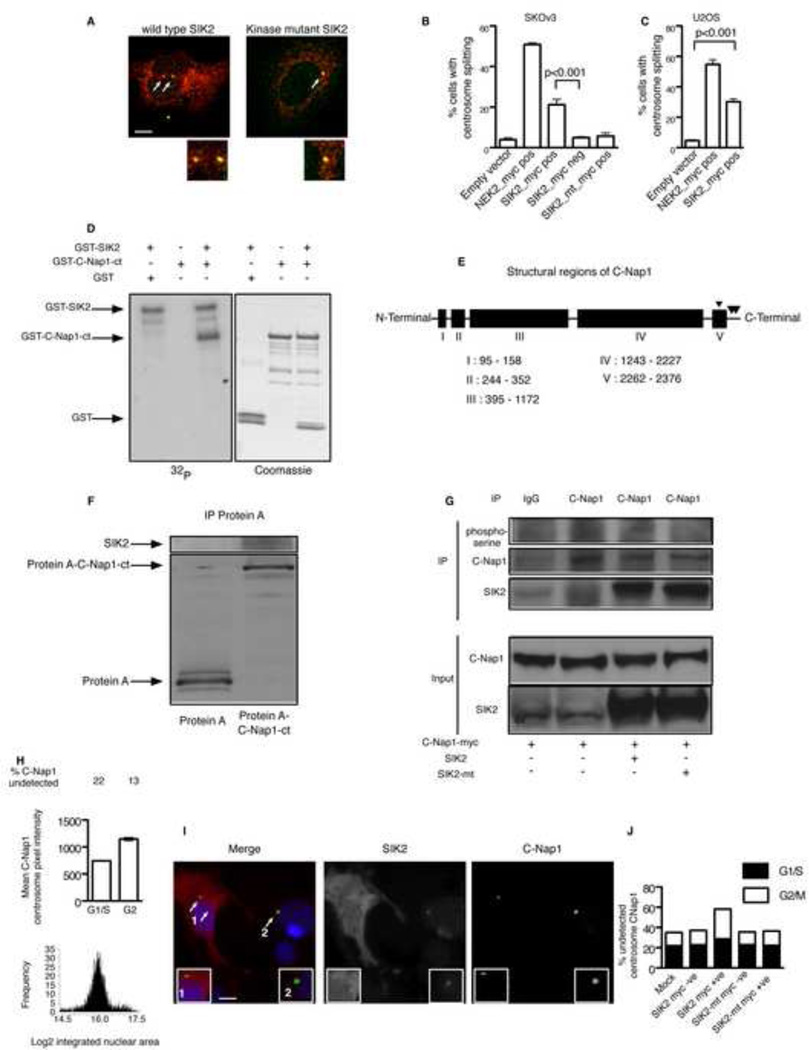
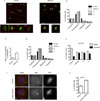
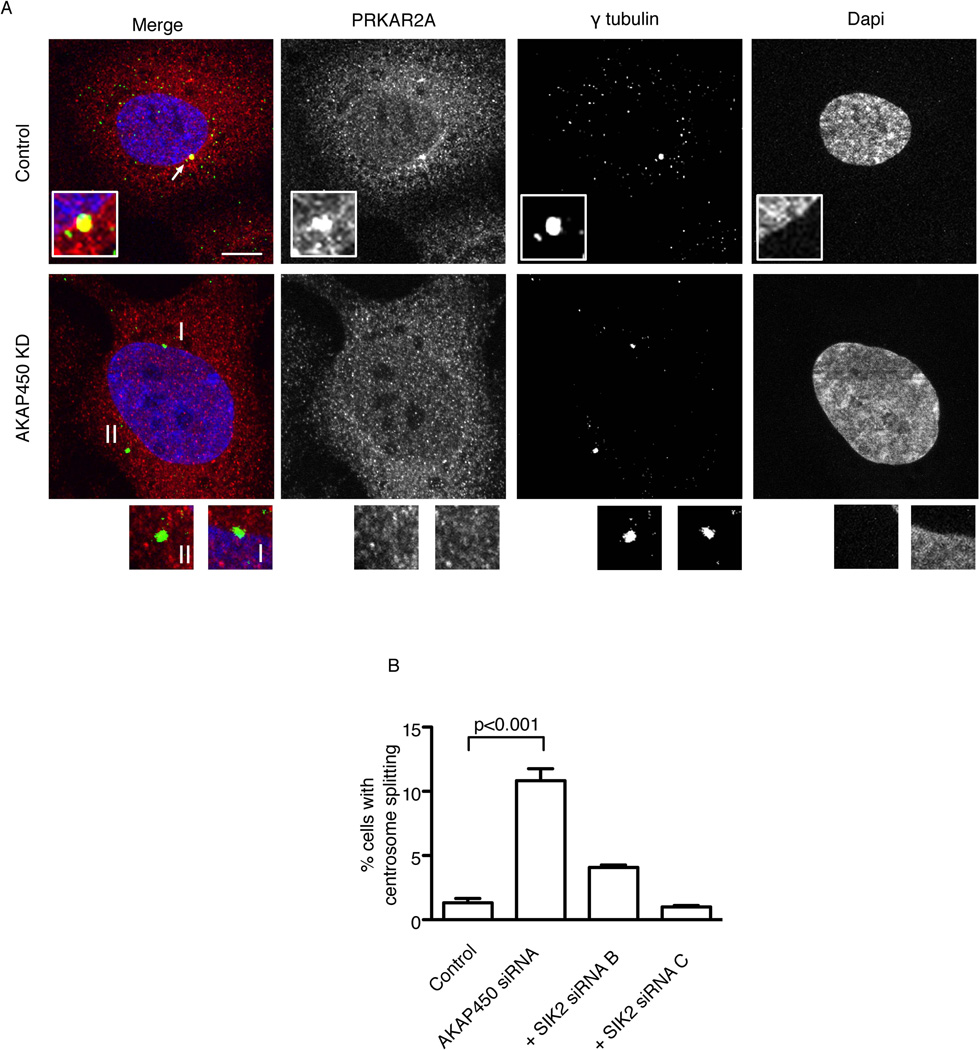
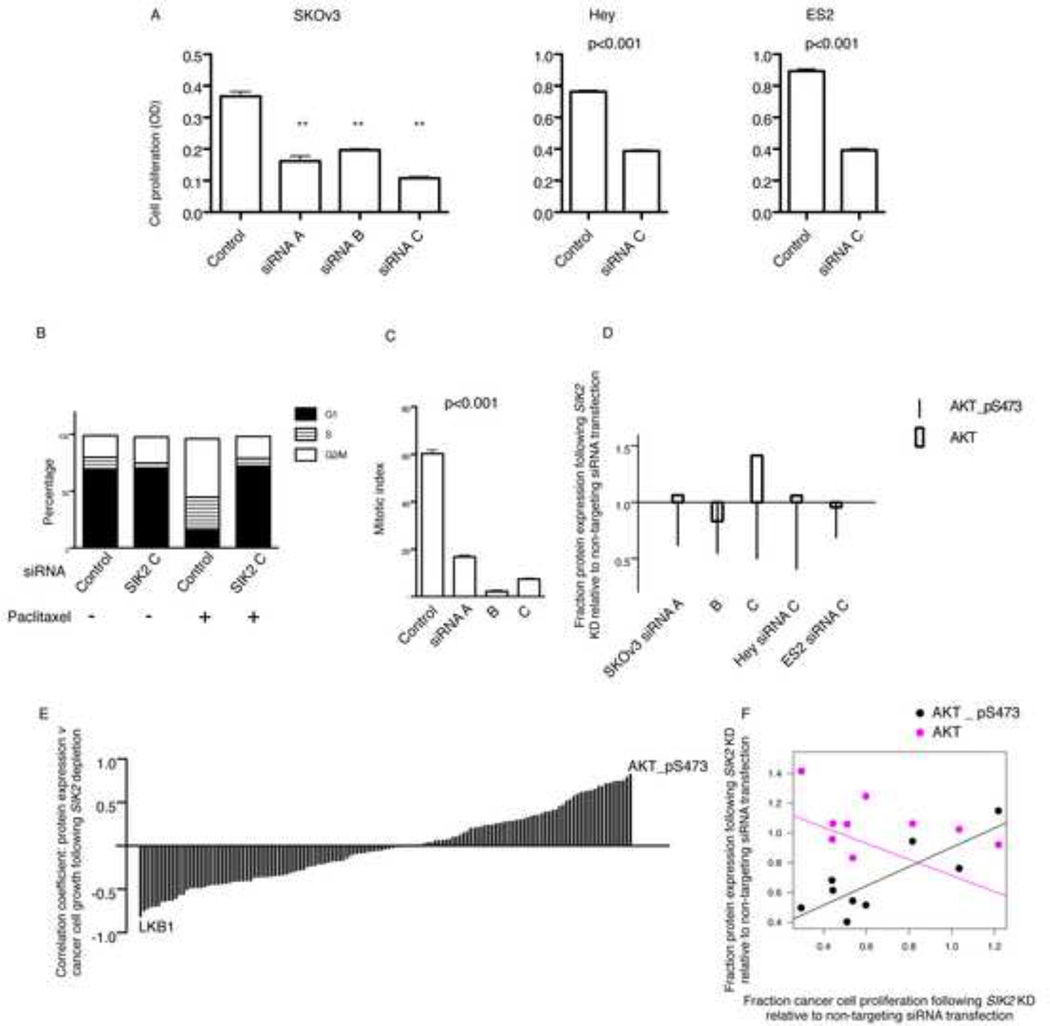
Regulators of mitosis have been successfully targeted to enhance response to taxane chemotherapy. Here, we show that the salt inducible kinase 2 (SIK2) localizes at the centrosome, plays a key role in the initiation of mitosis, and regulates the localization of the centrosome linker protein, C-Nap1, through S2392 phosphorylation. Interference with the known SIK2 inhibitor PKA induced SIK2-dependent centrosome splitting in interphase while SIK2 depletion blocked centrosome separation in mitosis, sensitizing ovarian cancers to paclitaxel in culture and in xenografts. Depletion of SIK2 also delayed G1/S transition and reduced AKT phosphorylation. Higher expression of SIK2 significantly correlated with poor survival in patients with high-grade serous ovarian cancers. We believe these data identify SIK2 as a plausible target for therapy in ovarian cancers.


Figures

Figure 1
Figure 1. A kinome siRNA screen identifies regulators of G2/M progression in ovarian cancer
A) A schematic presentation of the siRNA kinome screen. B–H) Each of the 779 genes included in the screen was targeted using pools of 4 individual siRNAs. These pools were divided into three plates (320 pools for plates 1 and 2 and 139 pools in plate 3). Three replicates were used for each plate and ten images were obtained per well. Integrated nuclear intensity (INI) values for individual cells, defined as the nuclear area multiplied by its mean pixel intensity, were extracted from 32,400 images including a total of 1,946,532 cells. The calculation of the percentage shift of the median integrated nuclear intensity value (ploidy index) is explained in B–E. Images were obtained 48 hours following transfection with non-targeting siRNAs (B) or a pool of siRNAs targeting AURKB (C). Arrow heads in C point to examples of fused nuclei. Scale bar; 10 µm. The INI values were used to generate cell cycle histograms following non-targeting siRNA transfection (D) or AURKB siRNA transfection (E). Note the shift to the right of the log2 INI values in E as a consequence of tetraploidy. The ploidy index (PInd) was obtained as the percentage of the median INI following gene knockdown normalized to the median INI following control transfection. F) An example of the correlation between the ploidy indices of two replicate plates in the screen. In (G) the cutoff PInds for each plate and examples of the identified hits are shown. H) Shown is the percentage of the tetraploid cells in relation to the total number of cells following either paclitaxel treatment, as a positive control for tetraploidy, or knockdown of genes using four independent siRNAs. The mean ± standard deviations of triplicates is presented. See also Figure S1, Tables S1–3.
Figure 2
Figure 2. Depletion of SIK2 delays mitotic progression and sensitizes ovarian cancer cells to paclitaxel
A–D) SKOv3 cells were transfected with either non-targeting siRNA (A) or SIK2 siRNA (B) for 48 hr then monitored for 16 hr (one image every 5 minutes) using bright field phase-contrast microscopy. The time interval from nuclear envelope breakdown (0:00 in A and B) to anaphase onset (01:20 in control cells) was estimated. Arrows point to the cell under study. Time is shown as hours:minutes. Scale bar, 10 µm. In C Western blot confirmation of knockdown of SIK2 using 3 independent siRNAs compared to non-targeting siRNA control is shown. r-GST-SIK2; recombinant GST-tagged SIK2 was used on the same Western blot to confirm the antibody specificity. D) The mean ± s.e.m of the mitotic transition time (obtained as in A and B) is presented following control and SIK2 siRNA transfections. In E, SKOv3 cells (5000 cells per well) were reverse transfected in 96 well plates using either non-targeting controls or SIK2 siRNAs A, B and C for 24 hr and cells were then either a) fixed and stained using crystal violet to estimate the number of cells on the day of paclitaxel treatment (Day 0) or b) treated with either diluent or paclitaxel at 9 different concentrations. The latter group of cells was fixed and stained 72 hr following drug treatment. Growth of cells from day 0 to day 3 was estimated and the percentage paclitaxel-induced growth inhibition for each siRNA in relation to diluent treated cells transfected with the same siRNA was calculated and a least-squares fit was obtained to estimate the GI 50 as described in methods (Monks et al., 1991). Shown is the mean ± s.e.m from three replicates per concentration. In F the effect of depletion of SIK2 using siRNA C on paclitaxel response in three cell lines is shown. The experiment was conducted as in E. Shown is the mean ± s.e.m from six replicates per concentration. Also shown is the p value for the comparison between the GI 50 in cells transfected with non-targeting siRNA control v cells transfected with SIK2 siRNA. G) Microarray expression data for two probe sets representing SIK2 were used to generate Kaplan Meier survival curves for high expressing (defined as cancers with values above the median + (0.5 × median absolute deviation [MAD]) or low expressing (below the median − (0.5 × MAD) for 229 high-grade serous (HGS) ovarian cancers. See also Figure S2 and Movies Smov1–3.
Figure 3
Figure 3. SIK2 localizes at the centrosome
A) SKOv3 cells were fixed and stained for immunofluorescence (IF) using the indicated antibodies to show the co-localization between SIK2 and γ-tubulin. B) The co-localization of ectopically expressed myc-tagged SIK2 with γ-tubulin in SKOv3 cells is shown. Also note the peri-centrosomal expression of SIK2. Scale bar, 5 µm. See also Figure S3.
Figure 4
Figure 4. Overexpression of SIK2 induces centrosome splitting through phosphorylation of C-Nap1
A) SKOv3 cells were transfected with myc/flag-tagged wild type SIK2 or myc/flag-tagged kinase mutant SIK2 (SIK2_mt) plasmid for 24 hr then cells were fixed and stained using anti-myc antibody (red), and anti-γ-tubulin antibody (green). Arrow heads show an example of CS (inter-centrosome distance > 2µm) following SIK2 transfection. B–C) Mean ± s.e.m of the percentage of cells with CS 24 hr following transfection using the indicated plasmids. Overexpression of NEK2, which is known to induce CS, was used as a positive control in this experiment. Experiments were performed at least in triplicates. Scale bar, 5 µm. D) In vitro kinase assays were performed in the presence of either γ-32P-ATP followed by autoradiography, left, or ATP alone followed by Coomassie staining, right. The bands representing GST-C-Nap1-ct were cut and subjected to LC-MS analysis for protein identification and to detect sites of phosphorylation. E) A diagram showing the potential five coiled coil domains of C-Nap1 as predicted in the Uniport data base and the serine phosphohrylation sites detected by LC-MS at amino acids S2234, S2392 and S2394. F) Either Protein A alone or Protein A-tagged C-Nap1-ct were transiently expressed in 293-T cells then immunoprecipitated using Rabbit IgG coated beads followed by elution and separation of the precipitates using SDS-PAGE and immunoblotting using anti SIK2 antibody. G) 293T cells were transfected with the indicated plasmids for 24 hours, then lysates were collected and immunoprecipitation (IP) performed using the indicated antibodies. Immunoprecipitates were resolved by electrophoresis as described in methods then probed with pan anti-phosphoserine antibody initially then anti-C-Nap1 antibody using the same membrane. Also, shown is the immunoblot result for SIK2 performed on the same membrane. H) Cells were cultured in 384 well plates overnight then fixed and stained using Hoechst nuclear stain and anti-C-Nap1 antibody. Shown is the automated analysis of 4000 cells over 10 replicate wells (as described in Supplementary methods) to identify cell cycle histograms, mean centrosome intensity value for C-Nap1 ± s.e.m and the percentage of cells with undetectable C-Nap1 in the centrosomes. Mitotic cells were manually excluded from the analysis. I) Cells were transfected with SIK2 expressing construct for 24 hr then fixed and stained using the indicated antibodies. Note the lower C-Nap1 intensity in the centrosomes of SIK2-transfected cell (1) compared to untransfected cell (2) in the same field. Scale bar, 5 µm. Arrows point to magnified centrosome in the inset. J) Shown is the percentage of cells with undetectable C-Nap1 centrosome signal per cell cycle stage following transfection using the indicated plasmids. See also Figure S4.
Figure 5
Figure 5. SIK2 is required for centrosome separation in mitosis
A–E)Cancer cells were transfected with siRNAs for 48 hr as indicated then fixed and stained. In A and B SKOv3 cells were stained using anti-γ-tubulin (red) and anti-phosphohistone H3 (green) to reveal the centosome position in mitosis in relation to chromosomes. Note the presence of examples from different mitosis phases in control cells (1–4; prophase, prometaphase, metaphase and anaphase, respectively) compared to the predominance of prometaphase cells following SIK2 KD. Also shown are examples of multipolar (I) and monopolar (II) centrosome positioning following SIK2 KD. Bar plots in B and D represent the mean ± s.d. of the percentages of cells at different stages of mitosis. Bar plots in C represent the mean prometaphase/metaphase ratio ± standard deviation. F–G) DMEL Drosophila cells were transfected using non-targeting control double stranded RNA (dsRNA) or dsRNAs targeting the Drosophila orthologue of SIK2. Examples of mitotic cells with failed centrosome separation are presented in F. In G, the mean ± s.d. of mitotic cells with failed centrosome separation from three independent experiments is shown. Scale bars, 10 µm. See also Figure S5.
Figure 6
Figure 6. The centrosome localization of PRKAR2A is required for regulating the appropriate timing of centrosome separation by SIK2
A-SKOv3 cells were transfected with the indicated siRNAs for 72 hours then fixed and stained. The centrosome expression of PRKAR2A is present in control cells (arrow) but absent following KD of AKAP450 (I and II). B) Bar plots represent the mean ± s.d. of triplicate percentages of cells with CS following transfection with the indicated siRNAs. Depletion of AKAP450 resulted in a significant increase in CS while co-depletion of AKAP450 and SIK2 rescued this phenotype. Scale bar, 5 µm. See also Figure S6.
Figure 7
Figure 7. SIK2 is required for AKT phosphorylation and growth of ovarian cancer cells
A) SKOv3, ES2 and Hey cells were either transfected using non-targeting control siRNA or the indicated SIK2 siRNAs for 5 days. Cells were fixed and stained using crystal violet. Shown is the mean ± s.e.m. of 12 replicate values per siRNA transfection type from two independent experiments in SKOv3 cells. ** indicates p<0.001. Error bars for Hey and ES2 cells represent the s.e.m. of 6 replicate values per siRNA transfection type from two independent experiments. B) Typical cell cycle distributions are presented following transfection of SKOv3 cells with the indicated siRNAs. C) Cells were transfected using the indicated siRNA for 48 hr then treated with paclitaxel 100 nM for 24 hr, fixed and stained using anti-phosphohistone H3 antibody to calculate the mitotic index (MI) using flow cytometry. Shown is the mean MI (± s.d.) of two independent experiments. D) Cell lines were transfected with the indicated SIK2 siRNAs and control non-targeting siRNAs for 48 hr then harvested for analysis of protein expression using reverse phase protein arrays. Shown is the fraction of expression of AKT-pS437 and total AKT following SIK2 siRNA transfection relative to protein expression following non-targeting siRNAs. E) The expression of 139 proteins (Supplementary Table S4) was estimated using reverse phase protein arrays as in D following transfection of cancer cells using three SIK2 siRNAs and one non-targeting control in 3 cell lines; SKOv3, Hey and ES2. The expression of each of the 139 proteins was correlated with cancer cell growth that was measured in A. Each bar represents the coefficient of the correlation between the expression of each of the proteins in 9 cell lines (3 SIK2 siRNAs × 3 cell lines) and the growth of the cancer cell line from which the protein was measured. Positive values indicate that higher expression of a protein correlates with more cancer cell growth. Negative values indicate that higher expression correlate with poor growth. F) Shown is the regression lines for the correlation between the fraction of ovarian cancer cell proliferation following SIK2 depletion relative to non-targeting control and the fraction expression of AKT-pS437 or total AKT following SIK2 depletion relative to non-targeting controls. See also Figure S7 and Table S4.
Figure 8
Figure 8. Loss of SIK2 sensitizes ovarian cancer cells to paclitaxel in vivo
A) A flow diagram showing the design of the in vivo experiment. B) Immunohistochemical confirmation of SIK2 depletion in SKOv3ip1 tissue sections using anti-SIK2 antibody. Scale bar, 50 µm. C–F) 5 µm sections from tumors were stained using the indicated antibodies. C–D) sections were stained using the indicated antibodies to calculate the mitotic index per field by manually counting phospho-Histone H3 positive nuclei and total number of nuclei. Shown in C is the mean ± s.e.m. of the MIs from 7 fields from two mice. In E an example of monopolar centrosome orientation following SIK2 KD in mice is shown. F) Bar plot representation of the mean ± s.e.m. of the percentage of mitotics with monopolar centrosome orientation from two mice (two slides per mouse). G–H) Mean tumor weights (± s.d.) obtained from 10 mice per siRNA type in SKOv3 cells and Hey cells. Scale bar, 10 µm.

Comment in

References

    1. Ahmed AA, Mills AD, Ibrahim AE, Temple J, Blenkiron C, Vias M, Massie CE, Iyer NG, McGeoch A, Crawford R, et al. The extracellular matrix protein TGFBI induces microtubule stabilization and sensitizes ovarian cancers to paclitaxel. Cancer Cell. 2007;12:514–527. - PMC - PubMed
    1. Bekier ME, Fischbach R, Lee J, Taylor WR. Length of mitotic arrest induced by microtubule-stabilizing drugs determines cell death after mitotic exit. Mol Cancer Ther. 2009;8:1646–1654. - PubMed
    1. Bettencourt-Dias M, Giet R, Sinka R, Mazumdar A, Lock WG, Balloux F, Zafiropoulos PJ, Yamaguchi S, Winter S, Carthew RW, et al. Genome-wide survey of protein kinases required for cell cycle progression. Nature. 2004;432:980–987. - PubMed
    1. Blagden SP, Molife LR, Seebaran A, Payne M, Reid AH, Protheroe AS, Vasist LS, Williams DD, Bowen C, Kathman SJ, et al. A phase I trial of ispinesib, a kinesin spindle protein inhibitor, with docetaxel in patients with advanced solid tumours. Br J Cancer. 2008;98:894–899. - PMC - PubMed
    1. Carlson CR, Witczak O, Vossebein L, Labbe JC, Skalhegg BS, Keryer G, Herberg FW, Collas P, Tasken K. CDK1-mediated phosphorylation of the RIIalpha regulatory subunit of PKA works as a molecular switch that promotes dissociation of RIIalpha from centrosomes at mitosis. J Cell Sci. 2001;114:3243–3254. - PubMed

Publication types

MeSH terms

Substances