
Regulation of tumor angiogenesis by EZH2

Chunhua Lu et al. Cancer Cell. .

Abstract

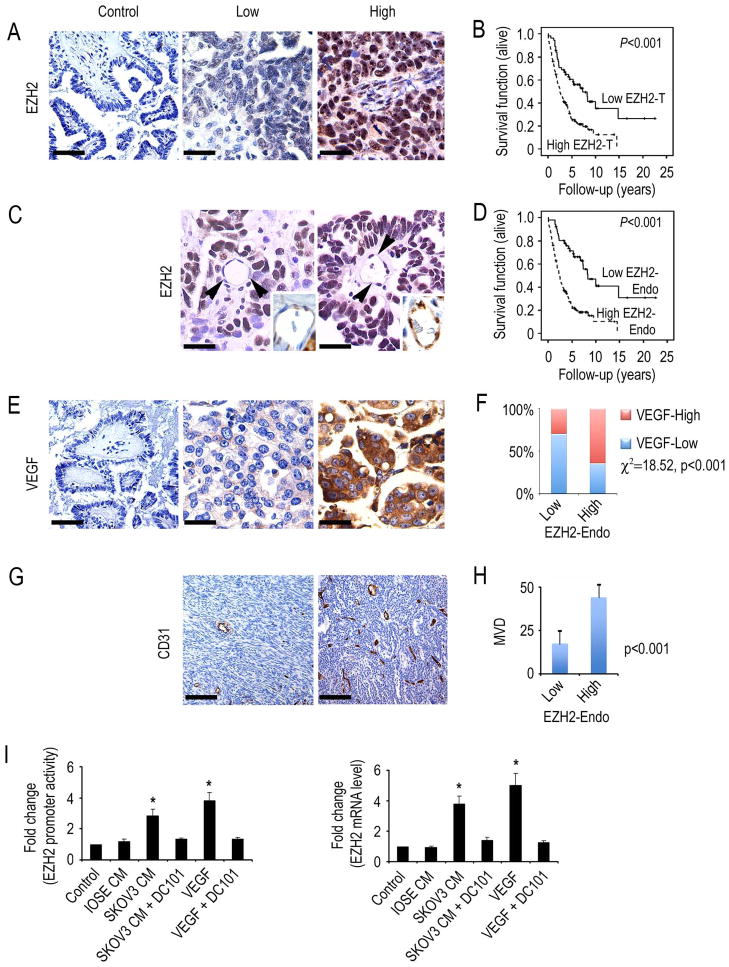
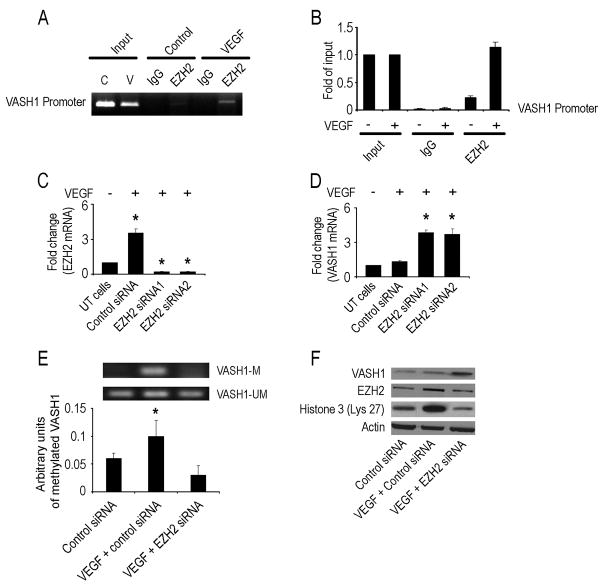
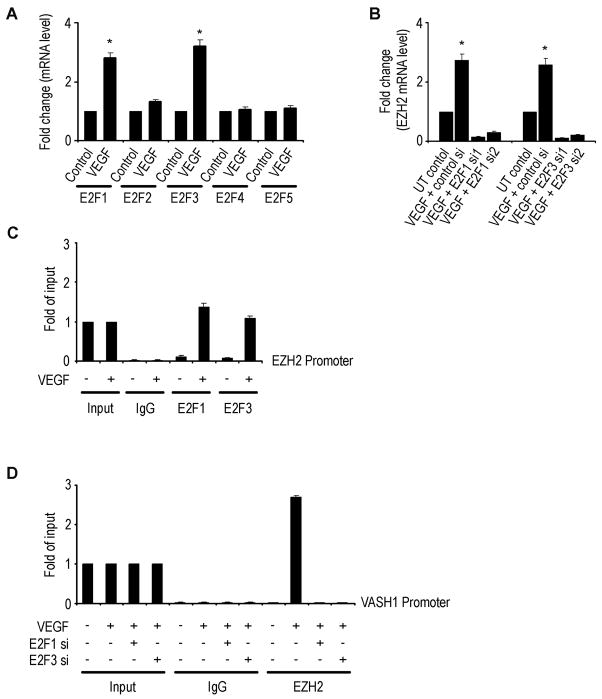
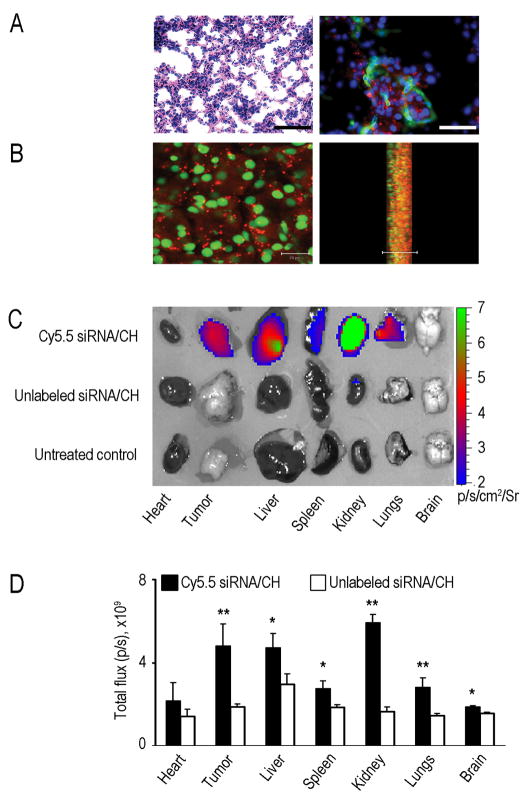
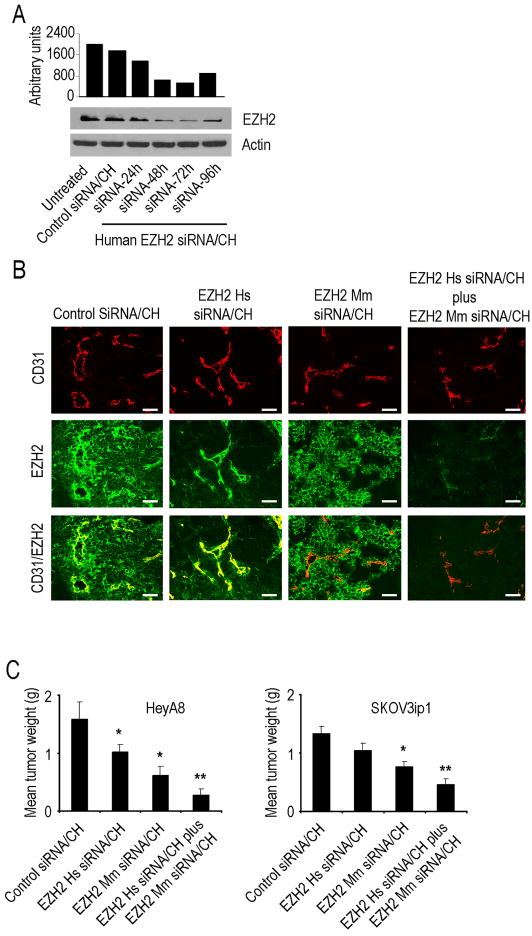
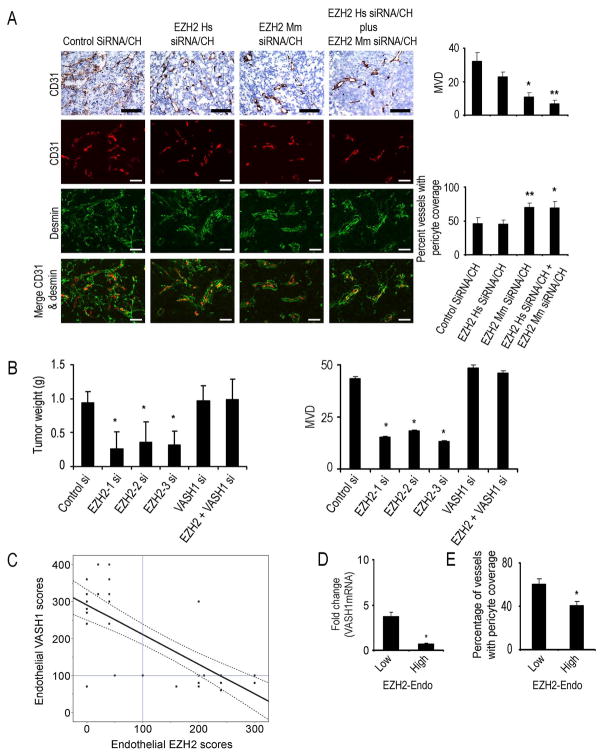
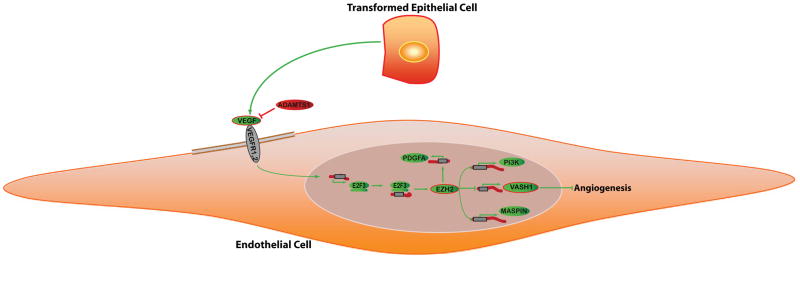
Although VEGF-targeted therapies are showing promise, new angiogenesis targets are needed to make additional gains. Here, we show that increased Zeste homolog 2 (EZH2) expression in either tumor cells or in tumor vasculature is predictive of poor clinical outcome. The increase in endothelial EZH2 is a direct result of VEGF stimulation by a paracrine circuit that promotes angiogenesis by methylating and silencing vasohibin1 (vash1). Ezh2 silencing in the tumor-associated endothelial cells inhibited angiogenesis mediated by reactivation of VASH1, and reduced ovarian cancer growth, which is further enhanced in combination with ezh2 silencing in tumor cells. Collectively, these data support the potential for targeting ezh2 as an important therapeutic approach.


Figures

Figure 1
Figure 1. EZH2 expression in human ovarian carcinoma
(A) Representative images of human tumors with low and high EZH2 expression based on immunohistochemical staining. Scale bar = 50 μm. (B) Kaplan-Meier curves of disease-specific mortality for patients whose ovarian tumors expressed high or low levels of EZH2 (EZH2-T). The log-rank test (two-sided) was used to compare differences between the two groups. Increased EZH2-T was significantly associated with decreased overall survival (p < 0.001). (C) Representative images of human ovarian cancer vasculature (arrowheads point to endothelial cells) with low or high immunohistochemical staining for EZH2. Scale bar = 25 μm. Insets show blood vessels at higher magnification. (D) Kaplan-Meier curves of disease-specific mortality of patients whose ovarian vasculature expressed low versus high EZH2 (EZH2-Endo). High EZH2-Endo expression was predictive of poor overall survival. (E) Representative images of human epithelial ovarian cancers with low or high immunohistochemical staining for VEGF. Scale bar = 50 μm. (F) VEGF expression was strongly associated with high EZH2-Endo expression levels. (G) Representative images of human ovarian cancers with low or high immunohistochemical staining for microvessel density (MVD). Scale bar = 100 μm. (H) Differences in mean MVD based on EZH2-Endo expression levels in human epithelial ovarian cancers. (I) VEGF increases EZH2 in endothelial cells. Results are in response to 6-hour treatment with VEGF (50 ng/mL), or conditioned medium (CM) from the non-cancerous ovarian epithelial cell line IOSE120, or the SKOV3 ovarian cancer cells. Fold changes represent the mean of triplicate experiments compared to untreated control cells. *p < 0.01. EZH2 promoter activity and mRNA levels are increased in mouse ovarian endothelial cells (MOEC) in response to VEGF, or conditioned media from ovarian cancer cells. Error bars indicate SD. See also Figure S1.
Figure 2
Figure 2. EZH2 gene silencing increases VASH1 mRNA expression in endothelial cells
(A) ChIP assay of EZH2 binding to VASH1 promoter in response to VEGF in mouse ovarian endothelial cells (MOEC). Cross-linked chromatin from MOEC was treated with (+) or without (−) VEGF and immunoprecipitated (IP) using EZH2 or mouse IgG antibodies. The input and immunoprecipitated DNA were subjected to PCR using primers corresponding to the 3800 to 3584 base pairs upstream of VASH1 transcription start site. PCR products were examined on ethidium bromide-stained agarose gel. (B) Quantitative ChIP assay of EZH2 binding to VASH1 promoter in response to VEGF in endothelial cells. Treatment conditions are similar to those described in Panel A. PCR products were examined by Roche SYBR Green System for quantitative PCR. (C) MOECs were transfected with control or mouse EZH2 siRNA (two different sequences) and harvested after 72 hours. Untransfected (UT) cells were used as controls. RNA was isolated and subjected to real-time quantitative RT-PCR. The fold difference represents the mean of triplicate experiments compared to control siRNA treated cells. *p < 0.01. (D) Fold change in VASH1 mRNA levels in MOEC following transfection with either control or EZH2 siRNA (two different sequences). *p < 0.01. (E) The effect of EZH2 gene silencing on VASH1 methylation in VEGF-treated MOECs was detected by methylation specific PCR. The inhibitory units of methylated VASH1 were normalized by that of the un-methylated VASH1 and represent the mean of triplicate experiments. *p < 0.05. (F) Western blot of lysate collected 48 hours after transfection of MOEC with control, VEGF treated and mouse EZH2 siRNA treated cells. Error bars indicate SEM. See also Figure S2.
Figure 3
Figure 3. E2F mediated regulation of EZH2 and VASH1
(A) Expression levels of E2F transcription factors in mouse ovarian endothelial cells (MOEC) following treatment with VEGF. *p < 0.01. (B) Effect of VEGF and either control, E2F1, or E2F3 siRNA (two different sequences) on EZH2 mRNA levels. The fold change in levels of mRNA expression represents the mean of triplicate experiments. *p < 0.01. (C) Quantitative ChIP assay of E2F1 and E2F3 binding to EZH2 promoter in response to VEGF in MOEC. Crosslinked chromatin from MOECs treated with (+) or without (−) VEGF 50 ng/mL was immunoprecipitated using E2F1, E2F3, or mouse IgG antibodies. The input and immunoprecipitated DNA were subjected to PCR using primers corresponding to the 442 to 151 base pairs upstream of EZH2 transcription site. PCR products were examined by Roche SYBR Green System for quantitative PCR. (D) Crosslinked chromatin from MOECs treated with (+) or without (−) indicated siRNA and with (+) or without (−) VEGF 50 ng/mL was immunoprecipitated using EZH2 or mouse IgG antibodies. The input and immunoprecipitated DNA were subjected to PCR using primers corresponding to the 3800 to 3584 base pairs upstream of VASH1 transcription site. PCR products were examined by Roche SYBR Green System for quantitative PCR. Error bars indicate SEM. See also Figure S3.
Figure 4
Figure 4. In vivo siRNA delivery using chitosan (CH) nanoparticles
Distribution of siRNA following single intravenous injection of Alexa-555 siRNA/CH nanoparticles in orthotopic HeyA8 tumor bearing nude mice. Fluorescent siRNA distribution in tumor tissue: (A) Hematoxylin and eosin, original magnification x200 (left); tumor tissues were stained with anti-CD31 (green) antibody to detect endothelial cells (right). Scale bar = 50 μm. (B) Sections (8-μm thick) were stained with sytox green and examined with confocal microscopy (scale bar 20 μm) (left); lateral view (right). Photographs taken every 1 μm were stacked and examined from the lateral view. Nuclei were labeled with sytox green and fluorescent siRNA (red) was seen throughout the section. At all time points, punctated emissions of the siRNA were noted in the perinuclear regions of individual cells, and siRNA was seen in >80% of fields examined. (C–D) Optical imaging of organs and tumors from HeyA8 tumor-bearing mice treated with either Cy5.5 siRNA/CH or unlabeled siRNA/CH. (C) Fluorescence intensity overlaid on white light images of different mouse organs and tumor. (D) Semi-quantitative evaluation of fluorescence intensity in different mouse organs. Error bars indicate SD. *p < 0.05;**p < 0.01. See also Figure S4.
Figure 5
Figure 5. Effects of EZH2 gene silencing on in vivo ovarian cancer growth
(A) Western blot of lysates from orthotopic tumors collected 24, 48, 72 and 96 hours after a single injection of control siRNA/CH or human (EZH2 Hs siRNA/CH). (B) EZH2 gene silencing in HeyA8 tumor as well as tumor endothelial cells. Tumors collected after 48 hours of single injection of control siRNA/CH, or EZH2 Hs siRNA/CH, or EZH2 Mm siRNA/CH and stained for EZH2 (green) and CD31 (red). Scale bar = 50 μm. (C) Effects of EZH2 Hs siRNA/CH or EZH2 Mm siRNA/CH on tumor weight in orthotopic mouse models of ovarian cancer. Error bars indicate SEM. *p < 0.05; **p < 0.001. See also Table S1; Figure S5.
Figure 6
Figure 6. Effect of EZH2 targeting on tumor vasculature
(A) Effect of tumor (EZH2 Hs siRNA/CH) or endothelial (EZH2 Mm siRNA/CH) targeted EZH2 siRNA on microvessel density (MVD) and pericyte coverage. Tumors harvested following 4 to 5 weeks of therapy were stained for CD31 (MVD; red) and desmin (pericyte coverage; green). Scale bar = 50 μm. The bars in the graphs correspond sequentially to the labeled columns of images at left. *p < 0.01; **p < 0.001. (B) Effects of VASH1 gene silencing on tumor growth in vivo. Nude mice injected with SKOV3ip1 ovarian cancer cells into the peritoneal cavity were randomly divided into 6 groups (10 mice per group): (1) control siRNA/CH (control si), (2) EZH2 Mm siRNA1/CH (EZH2-1 si), (3) EZH2 Mm siRNA2/CH (EZH2-2 si) (4) EZH2 Mm siRNA3/CH (EZH2-3 si) (5) VASH1 Mm siRNA1/CH (VASH1 si) and (6) combination of EZH2 Mm siRNA1/CH plus VASH1 Mm siRNA/CH. *p < 0.05. MVD is shown graphically in the adjacent graph. (C) Endothelial VASH1 protein expression is plotted against endothelial EZH2 expression in 37 epithelial ovarian cancer specimens. The best-fit linear regression model is depicted with 95% confidence limits (R2=−0.59, p < 0.001). The linear lines intersecting with 100 on each axis represent predetermined cut-off values of “high” vs. “low” expression. The presence of EZH2 expression was associated with low expression of VASH1, which was otherwise elevated in the absence of or in the presence of low EZH2 expression. (D) VASH1 mRNA levels were measured in endothelial cells isolated from normal ovarian (n=3), and epithelial ovarian cancer (n=10) samples using quantitative RT-PCR. The final mRNA levels in the tumor endothelial cells were converted to ratios of decreased ( 1) or increased (≤1) relative to levels of mRNA in normal ovarian endothelial cells (*p < 0.01). (E) Vessel maturation was examined by determining the extent of pericyte coverage in human epithelial ovarian cancer samples using an anti-alpha smooth muscle actin (ASMA) antibody. *p < 0.01. Error bars indicate SEM. See also Table S2; Figure S6.
Figure 7
Figure 7
Analysis of putative EZH2 pathways in cancer-associated endothelial cells. Pathway diagrams were generated with the assistance of Pathway Studio software (Ariadne, Rockville, MD). A model is reported in which VEGF stimulation leads to increased expression of E2F transcription factors, which directly modulates EZH2 levels. EZH2, a transcriptional repressor, causes VASH1 silencing by promoter methylation and subsequently increases angiogenesis.

References

    1. Ali-Fehmi R, Morris RT, Bandyopadhyay S, Che M, Schimp V, Malone JM, Jr, Munkarah AR. Expression of cyclooxygenase-2 in advanced stage ovarian serous carcinoma: correlation with tumor cell proliferation, apoptosis, angiogenesis, and survival. Am J Obstet Gynecol. 2005;192:819–825. - PubMed
    1. Burger RA, Sill MW, Monk BJ, Greer BE, Sorosky JI. Phase II trial of bevacizumab in persistent or recurrent epithelial ovarian cancer or primary peritoneal cancer: a Gynecologic Oncology Group Study. J Clin Oncol. 2007;25:5165–5171. - PubMed
    1. Burger RA, Brady MF, Bookman MA, Walker JL, Homesle HD, Fowler J, Monk BJ, Greer BE, Boente M, Liang SX. Phase lll trial of bevacizumab (BEV) in the primary treatment of advanced epithelial ovarian cancer (EOC), primary peritoneal cancer (PPC), or fallopian tube cancer (FTC): a Gynecologic Oncology Group Study. J Clin Oncol. 2010;28:7s.
    1. Cao R, Zhang Y. The functions of E(Z)/EZH2-mediated methylation of lysine 27 in histone H3. Curr Opin Genet Dev. 2004;14:155–164. - PubMed
    1. Cavalli G, Paro R. Chromo-domain proteins: linking chromatin structure to epigenetic regulation. Curr Opin Cell Biol. 1998;10:354–360. - PubMed

Publication types

Substances

Associated data