

Does midtrimester cervical length ≥25 mm predict preterm birth in high-risk women?
- PMID: 20708169
- PMCID: PMC2947582
- DOI: 10.1016/j.ajog.2010.06.025
Does midtrimester cervical length ≥25 mm predict preterm birth in high-risk women?
Abstract
Objective: We sought to assess pregnancy outcome along a continuum of cervical lengths (CLs) ≥25 mm.
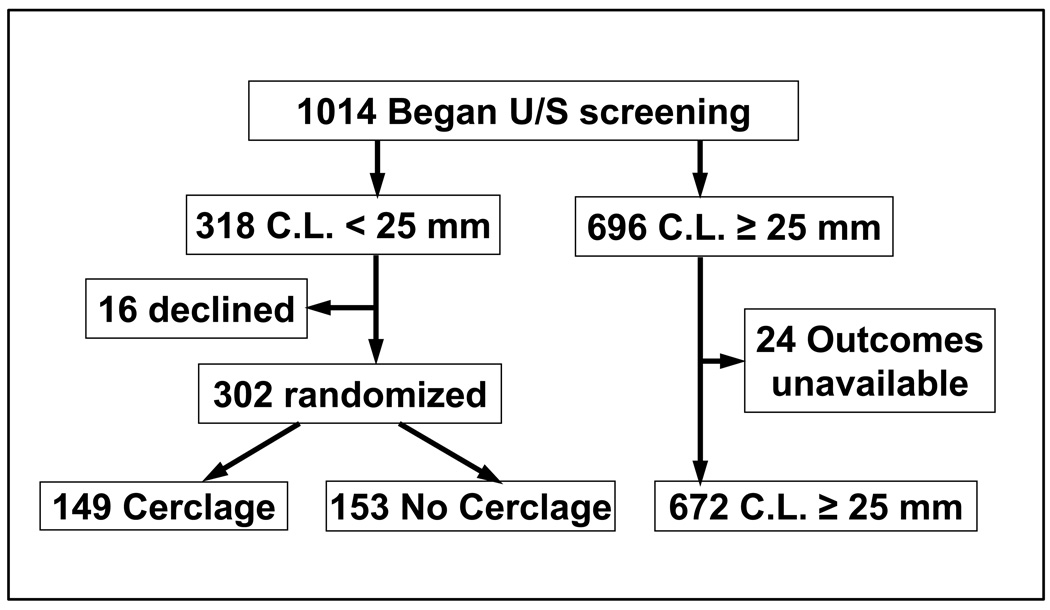
Study design: We conducted planned secondary analysis of a randomized cerclage trial of women with prior spontaneous preterm birth 17(0)-34(6/7) weeks. Outcomes of women who maintained CLs ≥25 mm were analyzed. Women with CLs <25 mm randomized to no cerclage comprised an internal comparison group.
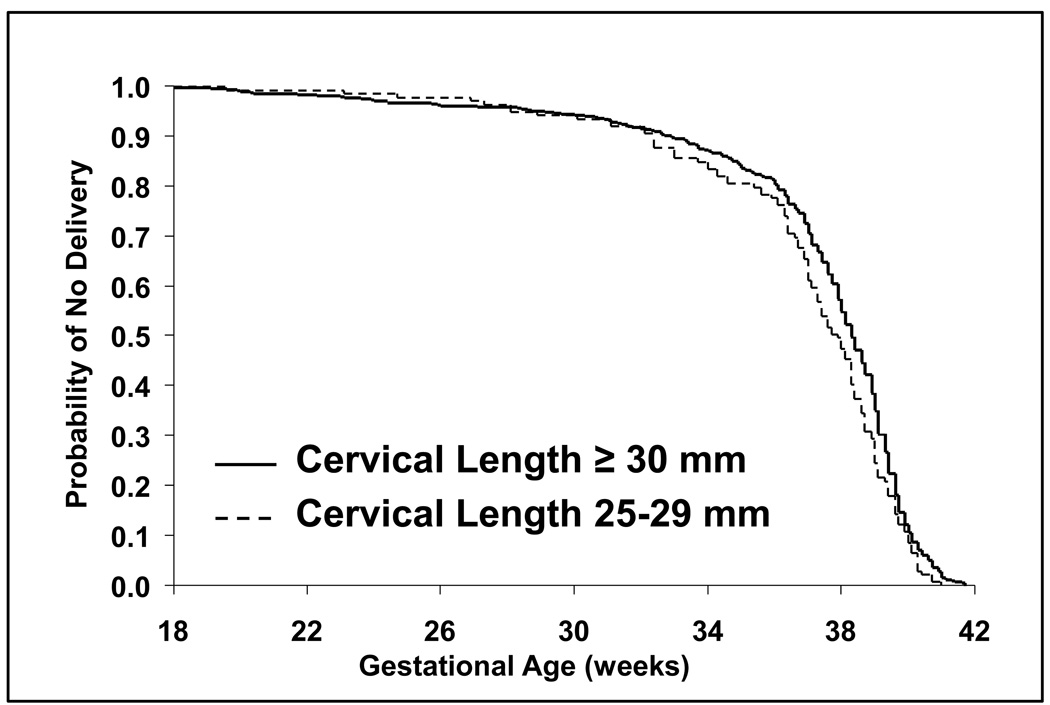
Results: Of 1014 screened, 153 had CL <25 mm, and 672 had CL ≥25 mm. Birth <35 weeks occurred in 16% of the ≥25 mm cohort. The relationship between CLs ≥25 mm and birth gestational age was null (P = .15). In the <25 mm group, progressively shorter CLs predicted birth <35 weeks (P < .001); this relationship was null in the ≥25 mm group (P = .17).
Conclusion: The continuum of CLs ≥25 mm measured between 16(0/7)-22(6/7) weeks does not predict gestational length in women with prior spontaneous preterm birth.
Copyright © 2010 Mosby, Inc. All rights reserved.
Figures

References
-
- Spong C. Prediction and prevention of recurrent spontaneous preterm birth. Obstet Gynecol. 2007;110:415. - PubMed
-
- Anonymous. American College of Obstetricians and Gynecologists. Assessment of risk factors for preterm birth. Practice bulletin Number 31. 2001 October - PubMed
-
- Owen J, Yost N, Berghella V, et al. for the National Institute for Child Health and Human Development Maternal Fetal Medicine Unit Network. Mid-trimester endovaginal sonography in women at high risk for spontaneous preterm birth. JAMA. 2001;286:1340–1348. - PubMed
-
- Crane JM, Hutchens D. Transvaginal sonographic measurement of cervical length to predict preterm birth in asymptomatic women at increased risk: a systematic review. Ultrasound Obstet Gynecol. 2008 May;31(5):579–587. - PubMed
-
- Honest H, Bachman LM, Coomarasamy A, Gupta JK, Kleijnen J, Khan KS. Accuracy of cervical transvaginal sonography in predicting preterm birth: a systematic review. Ultrasound Obstet Gynecol. 2003;22:305–322. - PubMed
Publication types
MeSH terms
Grants and funding
LinkOut - more resources
Full Text Sources
Medical
