

Review
doi: 10.1016/j.nic.2010.04.003.
Imaging of brain tumors: MR spectroscopy and metabolic imaging
Affiliations
- PMID: 20708548
- PMCID: PMC2927327
- DOI: 10.1016/j.nic.2010.04.003
Item in Clipboard
Review
Imaging of brain tumors: MR spectroscopy and metabolic imaging
Neuroimaging Clin N Am.
2010 Aug.
Abstract
The utility of magnetic resonance spectroscopy (MRS) in diagnosis and evaluation of treatment response to human brain tumors has been widely documented. The role of MRS in tumor classification, tumors versus nonneoplastic lesions, prediction of survival, treatment planning, monitoring of therapy, and post-therapy evaluation is discussed. This article delineates the need for standardization and further study in order for MRS to become widely used as a routine clinical tool.
Copyright 2010 Elsevier Inc. All rights reserved.
Figures

Three different untreated, primary brain tumors recorded using MRSI at long echo time (TE 280 msec, 0.8 cm3 voxel size, 1.5T). (A) Glioblastoma multiforme (GBM) involving the left side of the corpus callosum has a large increase in Cho and decrease in NAA compared to the contralateral side. (B) Left frontal WHO grade II oligodendroglioma shows reduced NAA compared to the contralateral side and minimal increase in Cho. (C) Left parietal primary central nervous system lymphoma shows increased Cho and decreased NAA compared to the contralateral hemisphere.

Group average spectra from normal parietal white matter (n=6), astrocytoma grade II (n=5), meningioma (n=8), anaplastic astrocytoma (grade III) (n=7), metastases (n=6), and GBM (grade IV, n=13) recorded at 1.5T using single voxel spectroscopy (STEAM, TE = 30 ms, 4–8 cm3 voxel size). All lesions have reduced NAA and also lower Cr than normal white matter. Spectra from the necrotic core of metastases and GBM show reduced levels of all metabolites and elevated lipids (in contrast to the GBM spectrum in figure 1 which was non-necrotic). Grade II and III astrocytomas show elevated Cho and lactate signals; grade II astrocytomas also have a prominent myo-inositol (mI) signal. A signal from alanine (Ala) is assigned in the meningioma spectra. Reproduced with permission from reference (19).

MRSI (PRESS: TR/TE=1200/135 ms; 24×24 matrix; FOV=200×200×15 mm3) and conventional MRI in a 56-year-old man who had chemotherapy after partial surgical resection of a GBM in the left temporal and inferior parietal lobe. The enhancing rim of the lesion is characterized by a high Cho signal (regions 2 and 4), while the central necrotic core (region 3) has elevated lipids and reduced levels of other metabolites. NAA is reduced in all T2-hyperintense regions, including the core and enhancing rim. The bright rim outside the brain in the Lip and NAA images arises from lipid signals in the scalp. Arrows in the Cr and Cho images metal point to field-inhomogeneity artifact due to surgical staples. Region 1 shows the normal spectrum from the right hemisphere. Data provided courtesy of Dr Alberto Bizzi, Istituto Neurologica Carlo Besta, Milan, Italy.

Example of MRI (FLAIR, and T1-weighted post-Gd), MRSI (Cho, Cr and NAA, 1.5T, TE 280 msec) and MR perfusion imaging (rCBV) in a 38 year old female with left parietal primary CNS lymphoma. This malignant, contrast-enhancing lesion shows both elevated rCBV and Cho, as well as reduced NAA. Adapted with permission from (38).

Example of MRI (FLAIR, and T1-weighted post-Gd), MRSI (Cho, Cr and NAA, 1.5T, TE 280 msec) and MR perfusion imaging (rCBV) in a 27-year old female with left frontal meningoencephalitis. This non-neoplastic, contrast-enhancing lesion shows decreased levels of all metabolites (Cho, Cr and NAA) suggestive of loss of cellularity and edema. Lesion rCBV is decreased cortically but appears mildly increased in the sub-cortical white matter. Adapted with permission from (38).
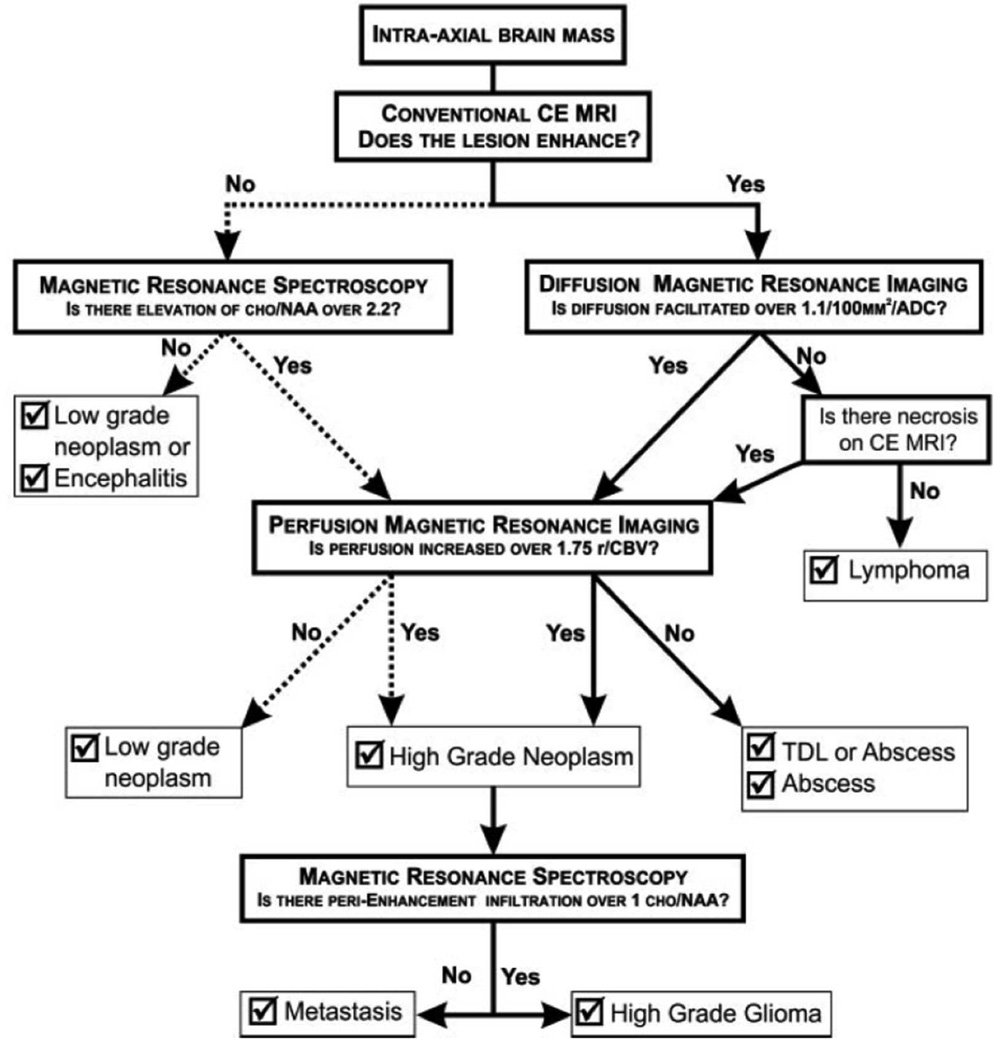
A flow-chart for determining brain lesion type based on conventional contrast-enhanced MRI, diffusion-weighted MRI, MR spectroscopy and MR perfusion imaging. Abbreviations: 1.1/100MM2/ADC = 1.1×10⁻³ mm2/sec, ADC = apparent diffusion coefficient, CE = contrast material enhanced, Cho = choline, NAA = N-acetylaspartate, rCBV = relative cerebral blood volume, TDL = tumefactive demyelinating lesion. Reproduced with permission from reference (50).
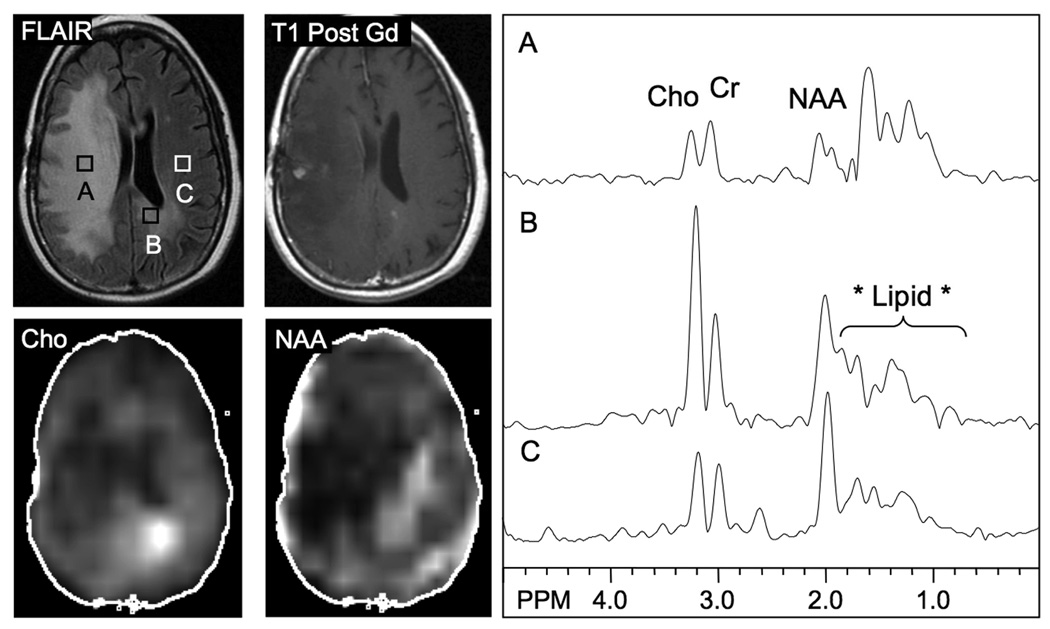
MRI (FLAIR, T1 post Gd) and MRSI (Cho, NAA) in a 53 year old female with a right frontal anaplastic astrocytoma previously treated with surgery and radiation. The T2 hyperintense large right hemisphere lesion is characterized by reduced levels of all metabolites (A), consistent with radiation necrosis, while high Cho is observed in the splenium of the corpus callosum crossing into the left hemisphere, consistent with tumor growth (B). A spectrum from a normal appearing region in the left hemisphere is shown in (C) for comparison. Note that the lipids seen in (A–C) most likely artifacts resulting from head motion during the scan, and also affect the reconstructed NAA image. Small nodules of contrast enhancement are seen in the right hemisphere and the left side of the corpus callosum. The MRSI results were in good accordance with an FDG-PET scan performed contemporaneously.
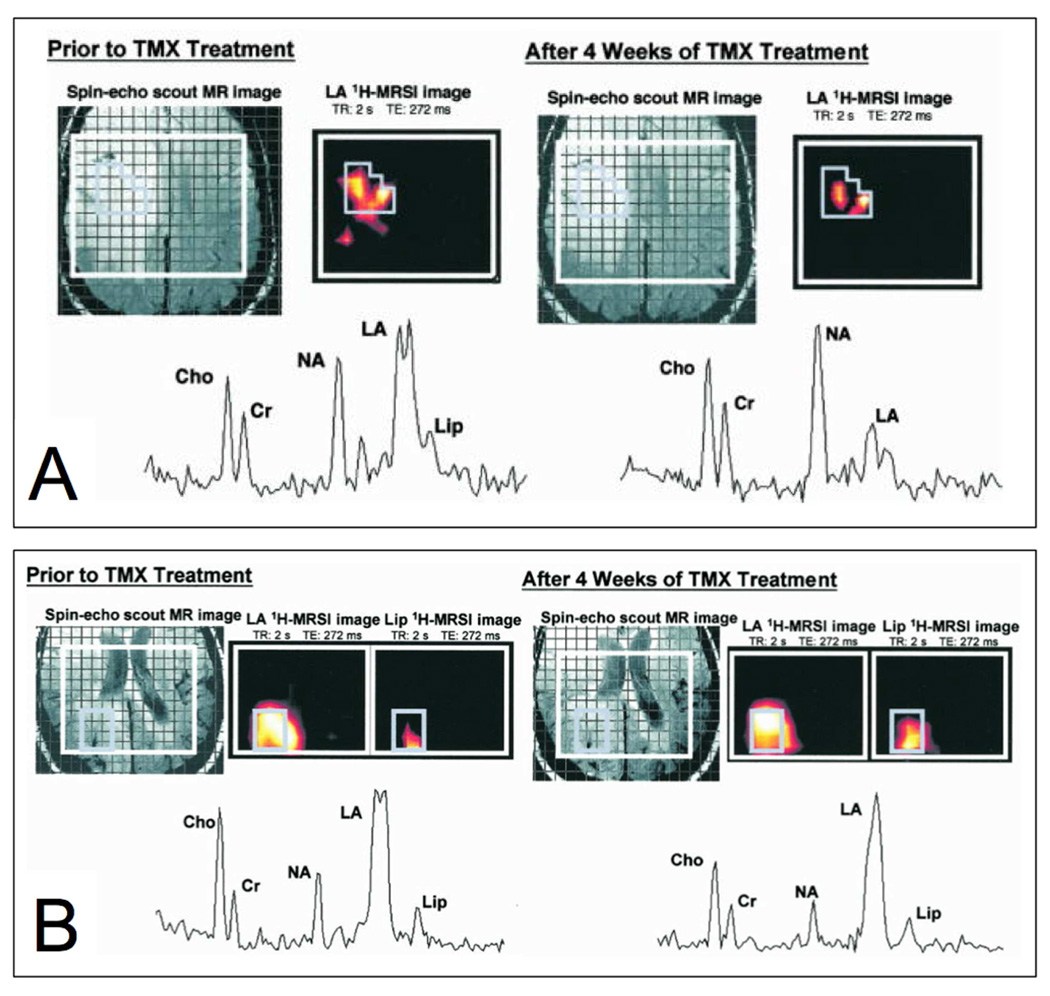
T2-weighted MRI and MRSI in two different cases with recurrent glioma before and after response to tamoxifen (TMX) therapy. Case (A), a recurrent astrocytoma, shows a large decrease in lactate in the lesion at one month, which corresponded to a clinical improvement in the patient, while other metabolites (Cho, Cr, NAA) are largely unchanged. (B) Case B, a recurrent GBM, did not respond the therapy and had symptom progression. The spectrum after 4 weeks of TMX is similar (in particular unchanged lactate levels) to that pretreatment. Adapted with permission from (107).
References
-
- Frahm J, Bruhn H, Gyngell ML, et al. Localized high-resolution proton NMR spectroscopy using stimulated echoes: initial applications to human brain in vivo. Magn Reson Med. 1989;9(1):79–93. - PubMed
-
- Bruhn H, Frahm J, Gyngell ML, et al. Noninvasive differentiation of tumors with use of localized H-1 MR spectroscopy in vivo: initial experience in patients with cerebral tumors. Radiology. 1989;172(2):541–548. - PubMed
-
- Barker PB, Glickson JD, Bryan RN, et al. In vivo magnetic resonance spectroscopy of human brain tumors. Top Magn Reson Imaging. 1993;5(1):32–45. - PubMed
Publication types
MeSH terms
Grants and funding
LinkOut - more resources
Full Text Sources
Other Literature Sources
Medical
