. 2010 Aug 17;19(2):245-58.
doi: 10.1016/j.devcel.2010.07.016.

CLASP promotes microtubule rescue by recruiting tubulin dimers to the microtubule

Affiliations

CLASP promotes microtubule rescue by recruiting tubulin dimers to the microtubule

Jawdat Al-Bassam et al. Dev Cell. .

Abstract

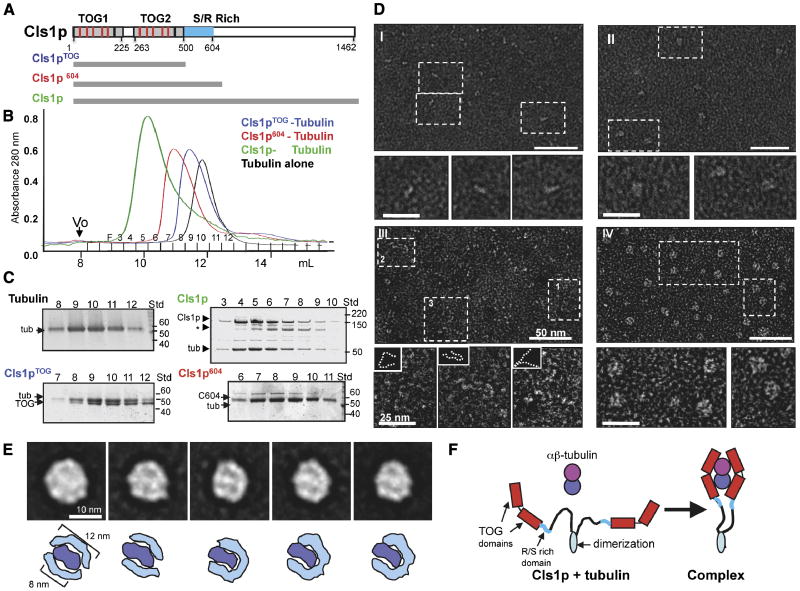
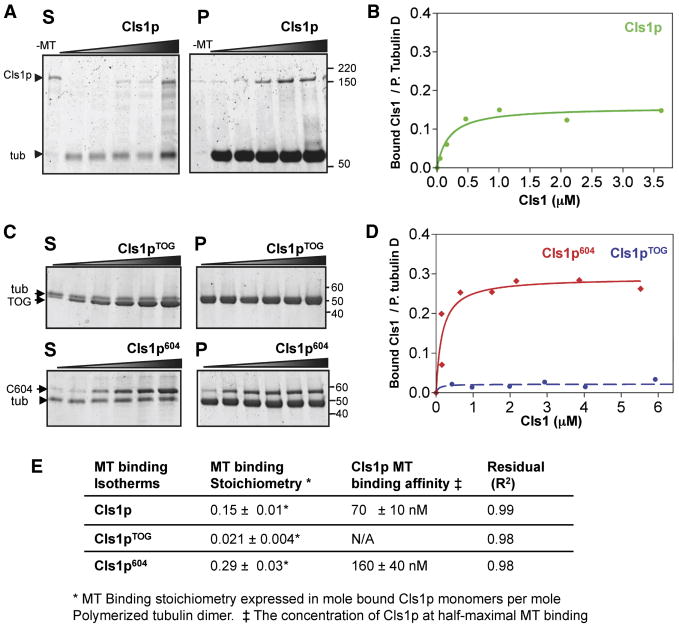
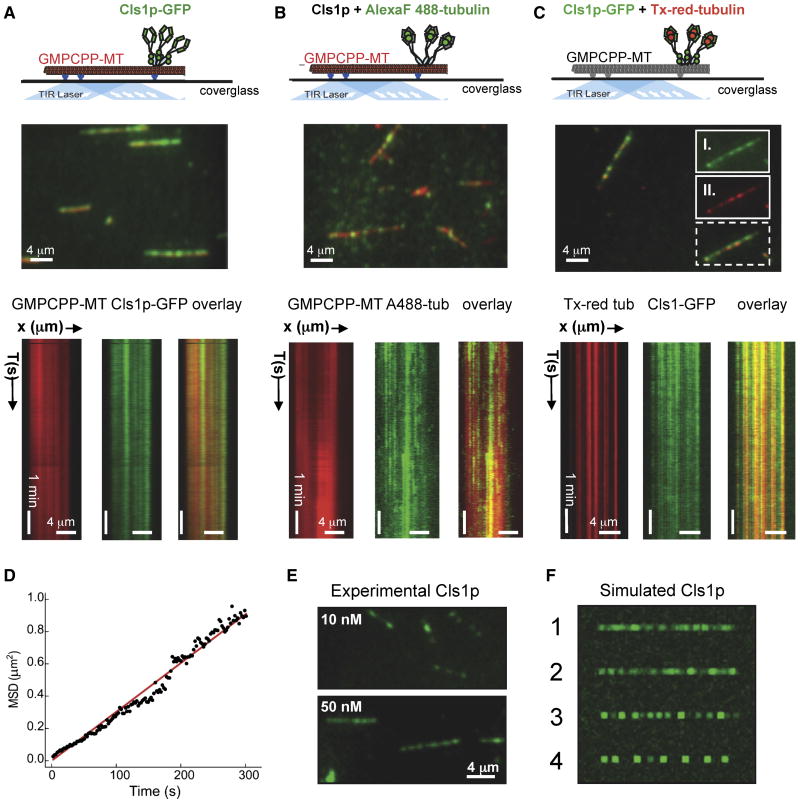
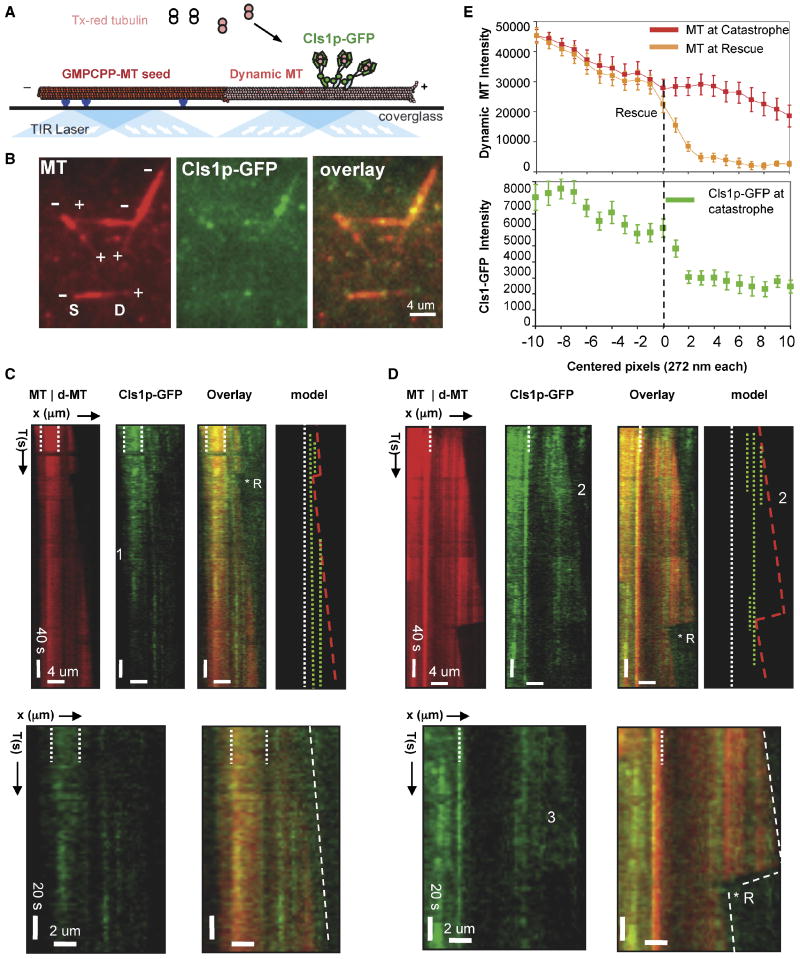
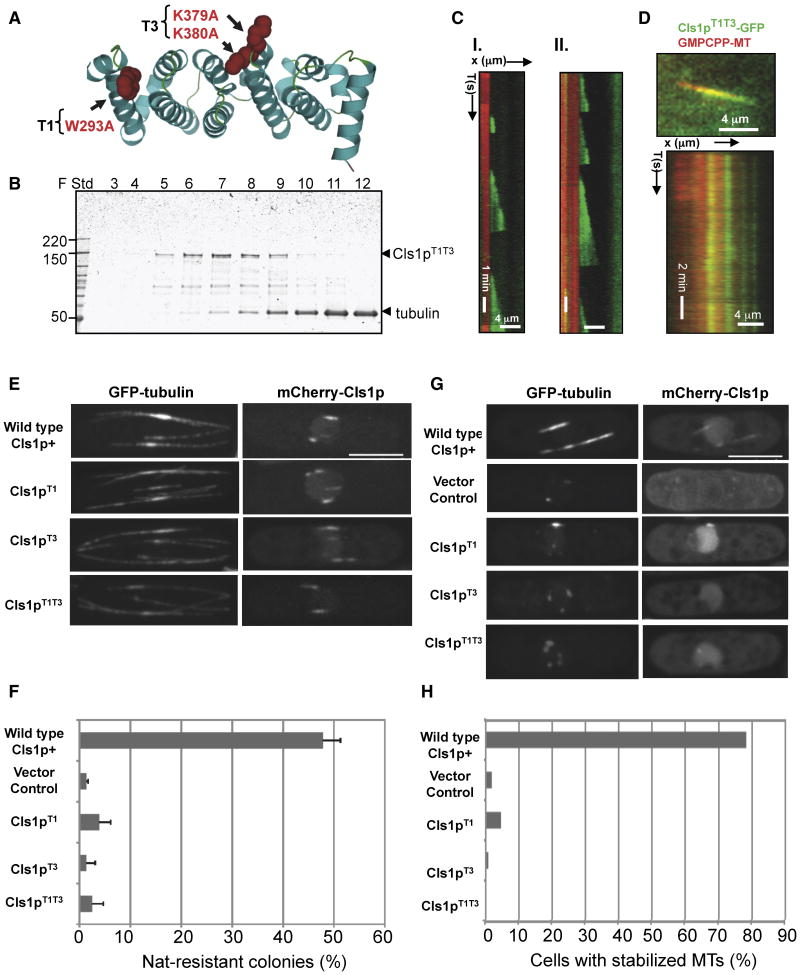
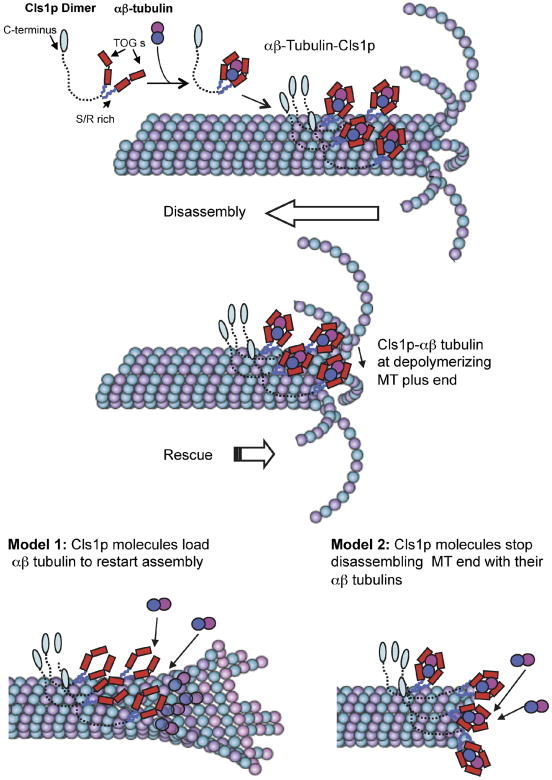
Spatial regulation of microtubule (MT) dynamics contributes to cell polarity and cell division. MT rescue, in which a MT stops shrinking and reinitiates growth, is the least understood aspect of MT dynamics. Cytoplasmic Linker Associated Proteins (CLASPs) are a conserved class of MT-associated proteins that contribute to MT stabilization and rescue in vivo. We show here that the Schizosaccharomyces pombe CLASP, Cls1p, is a homodimer that binds an alphabeta-tubulin heterodimer through conserved TOG-like domains. In vitro, CLASP increases MT rescue frequency, decreases MT catastrophe frequency, and moderately decreases MT disassembly rate. CLASP binds stably to the MT lattice, recruits tubulin, and locally promotes rescues. Mutations in the CLASP TOG domains demonstrate that tubulin binding is critical for its rescue activity. We propose a mechanism for rescue in which CLASP-tubulin dimer complexes bind along the MT lattice and reverse MT depolymerization with their bound tubulin dimer.


Figures

Figure 1
Figure 1. CLASP wraps around a tubulin dimer with two sets of TOG domains
A) Domains of Cls1, as a typical CLASP protein. TOG-like and serine/arginine (S/R)-rich domains are in grey and blue, respectively. Studies with Cls1pTOG (residues 1-500), Cls1p604 (residues 1-604), and full length Cls1p (residues 1-1462) are described in this figure. CLASPs contain Two TOG-like domains each with five, tubulin-binding, intra-HEAT repeat turns (red lines in upper panel) identified by structure-based sequence alignments with XMAP215/Dis1 TOG domains (detailed in Fig S1A B). B, C) Size exclusion chromatography of recombinant S. pombe Cls1p constructs. Intensity traces of Cls1pTOG (blue) and Cls1p604 (red) in complexes with soluble tubulin dimers indicate that Cls1p-tubulin complexes elute earlier than tubulin dimer alone (black). Cls1p-tubulin (green) elutes earlier than all other complexes, suggesting an extended conformation. SDS-PAGE of fractions from size exclusion chromatography (Panel C); Cls1pTOG and Cls1p604 co-elute with tubulin as complexes containing 1 Cls1p: 1 tubulin. The Cls1p604-tubulin complex elutes substantially earlier than Cls1pTOG-tubulin, indicating a higher Stokes radius (Supplementary Table S1). SDS-PAGE of fractions from Cls1p-tubulin complex peak shows that the peak saturates with a stoichiometry of 2 cls1p to 1 tubulin dimer, two-folds higher than the Cls1pTOG and Cls1p604 constructs. Asterisk (*) shows a very small amount of degraded inactive Cls1p. Supplementary data (Supplementary Table S1 Fig. S2) show that Cls1p is a dimer that binds a single tubulin dimer tightly, while Cls1pTOG and Cls1p604 are monomers that dissociate quickly from tubulin. D) Negative stain electron microscopy of Cls1p and Cls1pTOG in the presence and absence of tubulin dimer. Panel I: Cls1pTOG; higher magnification images below panel I, show that the elongated Cls1pTOG molecules are ∼10 nm in length. In panel II, images of purified Cls1pTOG-tubulin dimer complexes immediately after size exclusion chromatography elution. Cls1pTOG appears to bind a tubulin dimer along its length. Panel III: Full-length Cls1p appears to be extended and contain flexible linkers. Panel IV: Full-length Cls1p-tubulin complexes are compact particles of uniform globular shape. Line traces of the lower magnification images in panel III are shown as broken lines as insets above each higher magnification image below panel III. E) Upper panel: Images of five representative class averages from a reference-free classification of 2700 full length Cls1p-tubulin single particle images. The full image classification (Fig S2C) shows that Cls1p-tubulin complexes are homogenous with defined substructure. In each class average, two thin rim densities, about 12 nm in length encircle an elongated 8 nm density at the center of the particle. Lower panel: Interpretive drawing showing the outer rim densities as two sets of TOG domains (cyan) and the central density as a single tubulin dimer (blue). F) Model for the CLASP conformational change accompanying the binding of a tubulin heterodimer. The C-terminal domains (900 residues) of Cls1p are flexibly linked with respect to the tubulin complex.
Figure 2
Figure 2. CLASP S/R rich domains bind MT lattices with high affinity
A) Cls1p co-sedimentation with GMPCPP-stabilized MTs. SDS-PAGE of separated pellet (P) and supernatant (S) at low concentration, Cls1p is fully MT-bound (pellet), whereas at higher concentrations excess Cls1p is unbound (supernatant). Cls1p does not sediment in the absence of MTs (-MT lanes). Tubulin dimer does not affect Cls1p binding to GMPCPP-MTs (Fig S1A). Unlike Cls1p, XMAP215 does not bind GMPCPP-MTs with high affinity (Fig S2B). B) Binding isotherm of Cls1p and GMPCPP-stabilized MTs determined from data shown in A (see Methods). C) MT co-sedimentation analysis of Cls1pTOG, Cls1p604 constructs. Lower panel: Cls1p604 (containing S/R-rich domain) binds and sediments with GMPCPP-MTs with high affinity, while the top panel shows that Cls1pTOG does not sediment with MTs. D) MT binding isotherms for Cls1pTOG and Cls1p604 determined from data shown C. E) MT binding affinities and MT binding stoichiometries, in moles of Cls1p monomer per polymerized tubulin dimer, for full length Cls1p, Cls1pTOG and Cls1p604.
Figure 3
Figure 3. Effect of CLASP on MT dynamics parameters
A) Scheme for total internal refection fluorescence (TIRF) microscopy used to study MT dynamics. Surface-attached anti-biotin antibodies (blue) bind biotin-labeled GMPCPP-stabilized MT seeds (red). The seeds near the surface nucleate AlexaFluor-488-labeled (green) dynamic MTs from 6 μM soluble tubulin dimers in the presence of GTP. TIRF illumination by 564 nm and 488 nm lasers. Image adapted from Brouhard et al (2008). B) TIRF image of assembling MTs. Seeds (red) initiate assembly of dynamic MTs (green) at plus ends (+) only. C) Kymographs of assembly and disassembly of single dynamic MTs.
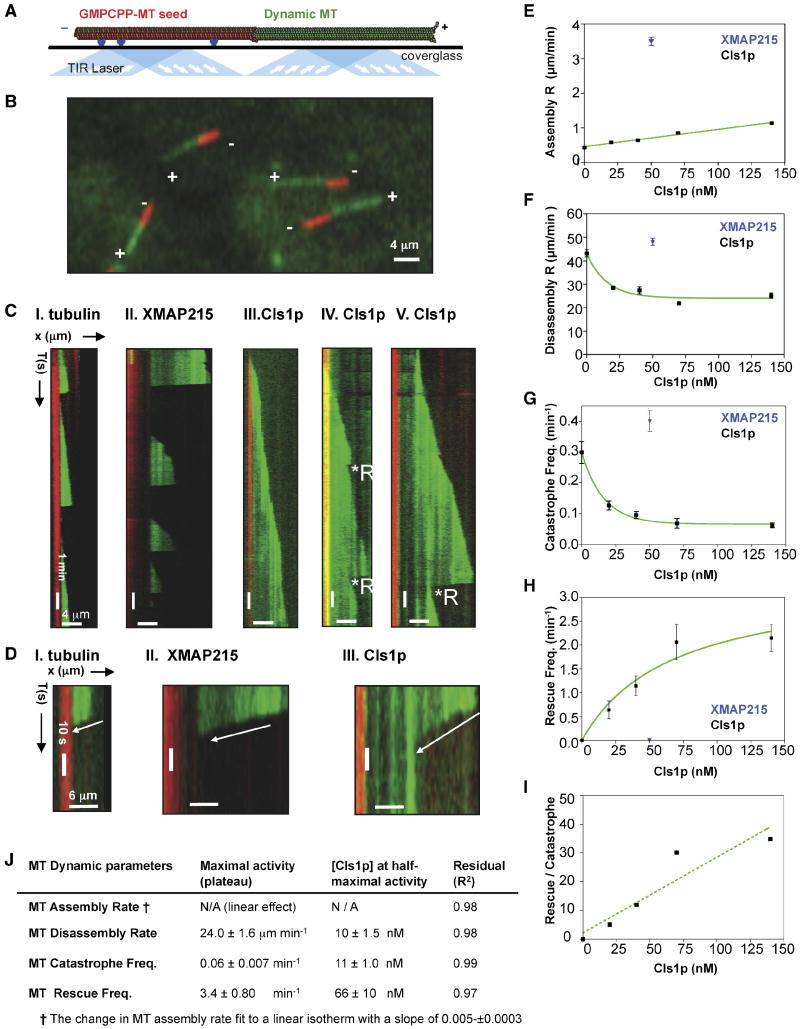
  1. I. 6 μM tubulin: dynamic MTs show slow assembly, rapid disassembly, and frequent catastrophes.

  2. II. 50 nM XMAP215 + 6 μM tubulin: dynamic MTs show rapid MT assembly and frequent catastrophes.

  3. III-V. 40 nM Cls1p + 6 μM tubulin: Panel III shows a relatively slow assembly MT rate and no catastrophes. Panel IV shows a dynamic MT assembling slowly with two catastrophes, each followed by a rescue. Panel V shows a dynamic MT assembling slowly and a catastrophe that leads to extended disassembly, which is followed by a rescue.

D) Close-up kymographs in C show MT disassembly at higher time resolution. E) Effect of Cls1p concentration on MT assembly rate. Cls1p (black) accelerates MT assembly slightly, while 50 nM XMAP215 (blue) increases the assembly rate by ten-fold (Supplementary Table S2; Brouhard et al, 2008). Each point (Supplementary Table S2) represents the mean of Gaussian distribution fit of a large number of assembly events measured for each Cls1p concentration (distributions are shown in Fig S4A). F) Effect of Cls1p concentration on MT disassembly rates. Each point (Supplementary Table I) represents the mean of Gaussian distribution fits for a large number of events at different Cls1p concentrations (distributions are shown in Fig S4B). G) Effect of Cls1p concentration on MT catastrophe frequency (Supplementary Table S2). Each point (Supplementary Table S2) represents the mean from a Gaussian distribution to a large number of catastrophe frequencies measured for each Cls1p concentration (distributions are shown in Fig S4C). H) Effect of Cls1p concentration on the MT rescue frequency. Each point (Supplementary Table S2) is the mean rescue frequency measured for each Cls1p concentration shown in Fig S4D. I) Effect of Cls1p concentrations on the ratio of MT rescue to MT catastrophe. At 140 nM Cls1p, on average every MT catastrophe (one event per 15.6 minutes of MT assembly) was reversed by a rescue (one event per 45 seconds of MT disassembly). J) Table fitted Cls1p concentration and maximal effects summarizing data from panels E-I.
Figure 4
Figure 4. Cls1p-GFP molecules bind non-uniformly along GMPCPP-stabilized MTs and recruit soluble tubulin dimers
A) Top panel, TIRF experiment scheme to detect Cls1p-GFP binding to Texas-red GMPCPP MTs (red). Middle panel, TIRF image of 50 nM Cls1p-GFP (green) binding non-uniformly along GMPCPP MTs (red). Lower panel, kymographs of Cls1p-GFP (green, left) on GMPCPP-MT (red, middle) in isolated channels and overlaid (right). Non-uniform patches of densely bound Cls1p-GFP remain stationary along GMPCPP MTs. B) Top panel, TIRF experiment scheme to detect untagged Cls1p molecules (grey) recruiting Alexa-Fluor-488 labeled tubulin (green) while bound to GMPCPP MTs (red). Middle panel, TIRF image of Alexa-Fluor-488 labeled tubulin dimers (green) recruited to the GMPCPP MTs (red) by bound untagged-Cls1p. Lower panel Kymographs of Alexa-Fluor-488 labeled tubulin dimers (green, left) recruited by untagged Cls1p along GMPCPP-MTs (red, middle) in isolated channels and overlaid (right). C) Top panel, Schematic of TIRF experiment to simultaneously detect recruitment of Cls1p-GFP (green) and Texas-red tubulin (red) along non-labeled GMPCPP MTs (grey). Middle panel, TIRF image of 50 nM Cls1p-GFP (green) and 50 nM Texas red tubulin (red) binding non-uniformly along GMPCPP MTs (red). Inset panels II and I show raw images of Cls1-GFP and Texas-red tubulin bound along GMPCPP MTs in the isolated channels above their overlaid image (broken lines). Lower panel, Kymographs of GMPCPP-MT (red) in isolated channels and overlaid. Non-uniform patches of densely bound Cls1p-GFP remain stationary along GMPCPP MTs. Images in top panels were adapted from Brouhard et al (2008). D) Tracking of Cls1p puncta along dynamic MTs to determine the average diffusion coefficient (see supplementary materials and methods). E) Experimental images of 10 nM (upper panel) and 50 nM (lower panel) of Cls1p-GFP puncta bound along GMPCPP-MTs. F) Simulation of Cls1p-GFP binding along linear MT lattices comparing different degrees of self-association. Panel 1: a random association with MT lattice without diffusion. Panel 2: weak self-association among molecules while binding to the MT lattice binding. Panel 3: shows moderate self-association among Cls1p-GFP molecules. Panel 4; a high degree of self-association. Note that the degree of speckling and sharpness of puncta in experimental Cls1p-GFP images is similar to simulations in either panels 1 or 2, and different from simulations in panels 3 and 4
Figure 5
Figure 5. Sites of high CLASP concentration locally anticipate sites of MT rescues
A) Schematic of TIRF microscopy assay used for imaging MT dynamics and for simultaneous imaging of dynamic MTs and Cls1p-GFP localization. Anti-biotin antibodies (blue) capture biotin- and Texas-red labeled GMPCPP polymerized MT seeds (red) near the silanized glass surface. Densely labeled Texas-red MT seeds nucleate dynamic MT assembly from 6 μM tubulin dimers, less densely labeled with Texas–red, in the presence of GTP and Cls1p-GFP (see methods). Image adapted from Brouhard et al (2008). B) Raw TIRF image of dynamic MTs and Cls1p-GFP. Left panel: dynamic MTs growing at plus ends of MT seeds. Note, high fluorescence intensity of the MT seed compared to the dynamic MT. Middle panel: Cls1p-GFP non-uniformly bound along dynamic MTs (middle panel). Cls1p-GFP accumulates more densely along the seed. Right Panel: overlay of both images. C) Cls1p-GFP binding along assembling dynamic MTs. Left panel: kymograph of dynamic MT (dMT) growing from a more densely labeled GMPCPP-MT seed (delimited by white broken lines). A single catastrophe occurred and was reversed by a rescue (*R). MT assembly then continued without further catastrophes. Second from left: Cls1p-GFP molecules bind more densely along the GMPCPP MT seed than along growing MT. Photobleaching decreased Cls1p-GFP fluorescence at the position marked by the numeral 1. Sites occupied at high Cls1p-GFP concentration remain at fixed positions without diffusion. Third from left: sites of Cls1p-GFP binding along a growing MT. Right: model kymograph showing the positions of high local concentration of Cls1p-GFP (broken green lines) along dynamic MTs (boundaries in red lines). Higher magnification kymographs show Cls1p-GFP molecules bound along an assembling MT. Note the absence of MT plus-end tracking. An additional example is shown in Fig S6A, IV. D) Sites of high concentration of Cls1p-GFP molecules correlate with sites of MT rescue on a dynamic MT. Left panel: kymograph of dynamic MT (dMT) assembling from an intensely labeled GMPCPP-MT seed (MT, white broken lines). A catastrophe was followed by MT disassembly and a rescue (R*). Second panel from left: Cls1p-GFP (green) binds non-uniformly and without diffusion along the dynamic MT. Note that three Cls1p-GFP bands form, but two dissociate early during assembly (marked by the numeral 2). Third panel from left: sites of MT rescue correlate with positions of high Cls1p-GFP density (green) on a dynamic MT (red). Right: model kymograph showing the position of Cls1p-GFP dense bands (broken green) compared to the dynamic MT boundary (red) growing from the GMPCPP MT seed (broken white line). Higher magnification images show correlation of Cls1p “bands” with MT rescue. Additional examples are shown in Fig S6A, I-III. Note the loss in the diffuse Cls1p-GFP fluorescence (marked by #3) reproduces the MT disassembly rate. Fig S5C shows MT rescues were not observed in the absence of sites of high Cls1p-GFP concentration along dynamic MTs E) Correlation of local Cls1p-GFP concentration on the MT with MT rescue. Average fluorescence intensity profile (see Methods) of a dynamic MT before catastrophe (red profile), dynamic MT at rescue (orange profile), and Cls1p-GFP along dynamic MT before catastrophe (green profile) for 20 different rescue events (more details in Fig S6B). Note that the Cls1p-GFP intensity peaks within 1 pixel (272 nm) of the site of rescue and the increase is three folds higher at that site than any pixel prior. The raw intensity profiles for Cls1p-GFP with MT rescue and statistical significance of Cls1-GFP intensity increase are shown in Fig. S6B.
Figure 6
Figure 6. Defects of Cls1p mutants with inactivated TOG-tubulin interface
A) Ribbon model of a TOG domain (PDB ID 2OF3; Al-Bassam et al, 2007) showing W293 and K379/K380 (red space filling) in the intra-HEAT turns (T1 and T3) mutated in Cls1pT1T3 to disrupt tubulin dimer binding B) SDS-PAGE of size exclusion chromatography fractions of Cls1pT1T3 with tubulin dimer, as in the experiment with Cls1p in Fig 1A. The Cls1pT1T3 mutant does not co elute with tubulin dimer (tub); absorbance profile is shown in Fig S7A. C) Kymographs of dynamic MTs assembled in the presence of 200 nM recombinant Cls1pT1T3 as described in Fig 3B; note the frequent catastrophes and loss of rescues. Dynamic MT parameters (Supplementary Table S2), determined based on distributions, are shown in Fig S6D. D) Cls1p T1T3-GFP binding along GMPCPP MTs. Top panel: Raw image of Cls1T1T3-GFP binding non-uniformly along Texas-red GMPCPP MT (red) similar to Cls1p-GFP described in Fig 4E. Lower panel: kymograph of the Cls1pT1T3-GFP (green) on GMPCPP-MT (red), showing that Cls1T1T3-GFP distribution remained stationary throughout the experiment. Bulk MT co-sedimentation analysis shows that Cls1T1T3 binds MT with an affinity similar to wt Cls1p (Fig S7B). E) Localization of cls1p mutant proteins in vivo. Full length Cls1pT1, Cls1pT3 and Cls1pT1T3 were expressed as mCherry fusion proteins driven by the thiamine-repressible nmt1* promoter in S. pombe cells expressing GFP-tubulin. Cells were grown in thiamine for relatively low levels of expression. Note that the localization of cls1p to regions of MT overlaps on MT bundles is not perturbed in the cls1 TOG mutants. Maximum projection confocal images of representative cells are shown. F) Ability of the cls1 TOG mutant proteins to rescue viability of cls1 null cells. Diploid cls1+/cls1Δ cells carrying wild type or mutant cls1 plasmids were sporulated; resultant spores with plasmids were assayed for viability by measuring percentage of viable haploid Nat-resistant colonies carrying the with cls1Δ allele (see Methods). Full rescue of viability in cls1Δ is predicted to be 50% in this assay. Note that Cls1p T1, Cls1pT3, Cls1pT1T3 mutants are defective in rescuing the cls1p function in haploid cells, similar to vector control (detailed in Supplementary Table S3). G, H) Cls1-TOG mutants are defective in MT stabilization activity. Panel G: Cells carrying m-Cherry Cls1pT1, Cls1pT3 and Cls1pT1T3 were induced for higher expression by growing in media lacking thiamine in wild type cells expressing GFP-tubulin, and then assayed for stabilization by treatment with MT destabilizing drug, methyl-benzidazole-carbamate (MBC). Maximum projections of confocal images of representative cells are shown. Note that MT bundles are stabilized in cells overexpressing wild type mCherry-Cls1p, which binds along the MT lattice, whereas MTs in cells overexpressing the Cls1pT1, Cls1pT3, Cls1pT1T3 or vector controls are not stabilized and shrink to peri-nuclear dots. (Scale bar, 5 μm). Panel H: percentage of cells with stabilized cytoplasmic MTs 10 minutes after MBC treatment. MTs were with MBC. We considered a MT bundle as stabilized if it was ≥ 2 μm in length (detailed in Supplementary Table S3).
Figure 7
Figure 7. Mechanism of CLASP in promoting MT rescues
The S. pombe CLASP, Cls1p, is a dimer that binds a single αβ-tubulin dimer through two sets of TOG domains and binds to the MT lattice through two S/R rich domains. The C-terminal domain, shown extended, may bind other molecules. Cls1p dimers loaded with αβ-tubulin dimer bind non-uniformly along the MT lattice. When the disassembling end reaches a position of high local Cls1p density, Cls1p promotes rescue by halting disassembly and stimulating re-growth. Two models may explain Cls1p activity: model 1 shows Cls1p molecules loading their bound tubulin to MT plus end to restart assembly (left). Model 2 shows Cls1p molecules using their bound tubulin to halt protofilament and pause MT plus end disassembly. Dynamic MT Images were adapted from Akhmanova and Steinmetz (2008).

Similar articles

Cited by

References

    1. Akhmanova A, Hoogenraad CC, Drabek K, Stepanova T, Dortland B, Verkerk T, Vermeulen W, Burgering BM, De Zeeuw CI, Grosveld F, Galjart N. Clasps are CLIP-115 and -170 associating proteins involved in the regional regulation of microtubule dynamics in motile fibroblasts. Cell. 2001;104:923–935. - PubMed
    1. Akhmanova A, Steinmetz MO. Tracking the ends: a dynamic protein network controls the fate of microtubule tips. Nat Rev Mol Cell Biol. 2008;9:309–322. Epub 2008 Mar 2005. - PubMed
    1. Al-Bassam J, Larsen NA, Hyman AA, Harrison SC. Crystal structure of a TOG domain: conserved features of XMAP215/Dis1-family TOG domains and implications for tubulin binding. Structure. 2007;15:355–362. - PubMed
    1. Al-Bassam J, van Breugel M, Harrison SC, Hyman A. Stu2p binds tubulin and undergoes an open-to-closed conformational change. J Cell Biol. 2006;172:1009–1022. - PMC - PubMed
    1. Ambrose JC, Shoji T, Kotzer AM, Pighin JA, Wasteneys GO. The Arabidopsis CLASP gene encodes a microtubule-associated protein involved in cell expansion and division. Plant Cell. 2007;19:2763–2775. Epub 2007 Sep 2714. - PMC - PubMed

Publication types

MeSH terms