. 2010 Aug 17;19(2):329-44.
doi: 10.1016/j.devcel.2010.07.010.

Osteoblast precursors, but not mature osteoblasts, move into developing and fractured bones along with invading blood vessels

Affiliations

Osteoblast precursors, but not mature osteoblasts, move into developing and fractured bones along with invading blood vessels

Christa Maes et al. Dev Cell. .

Abstract

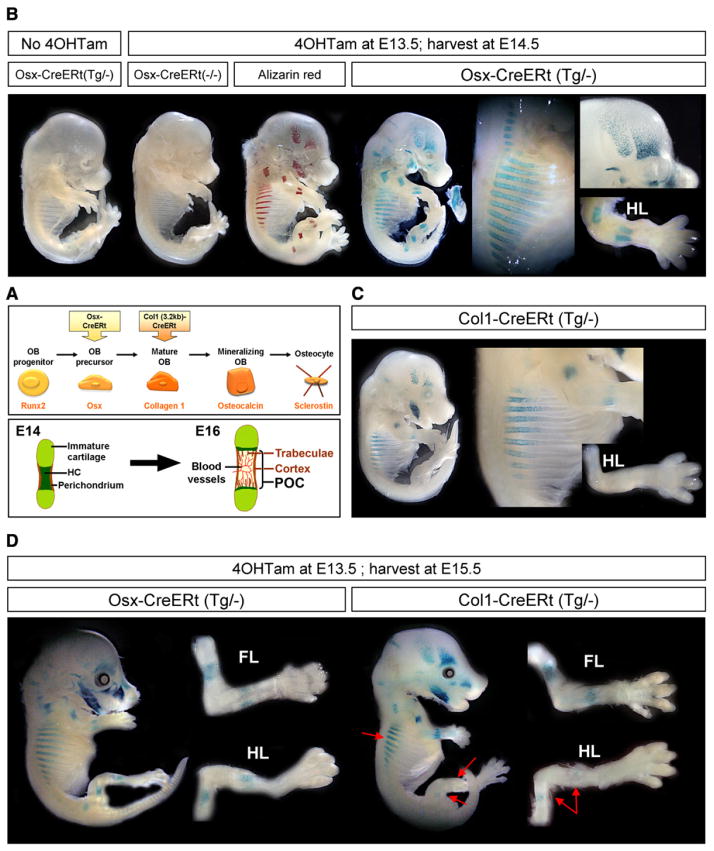
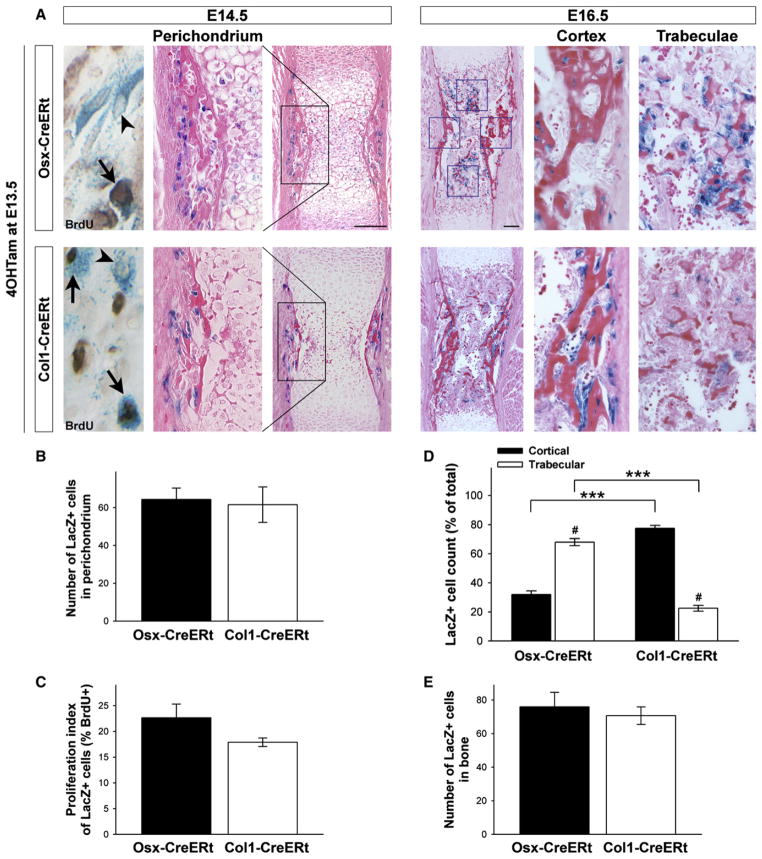
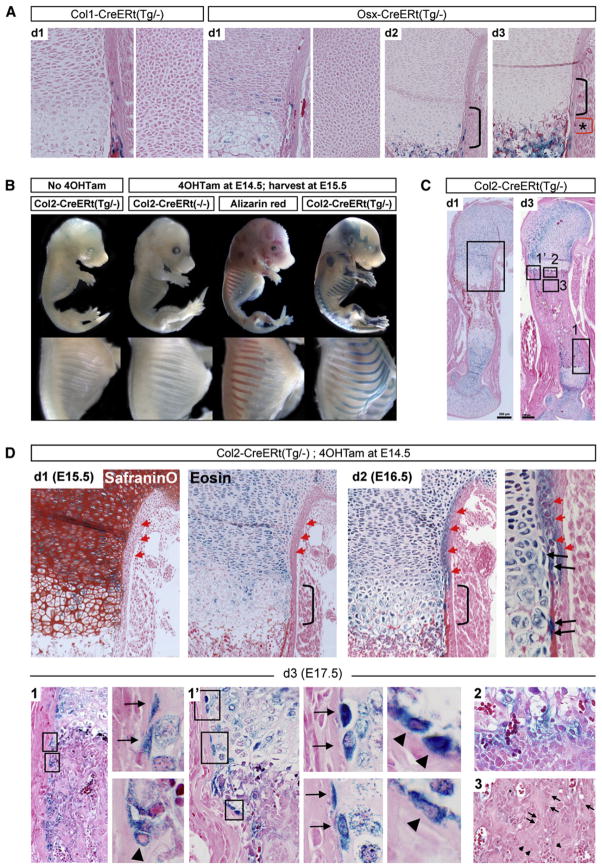
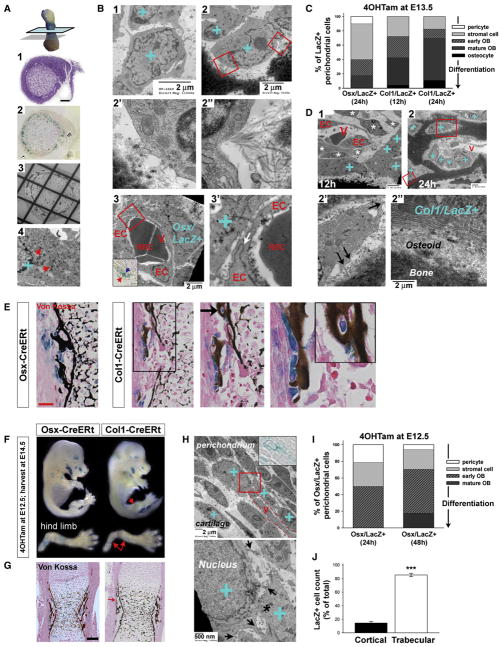
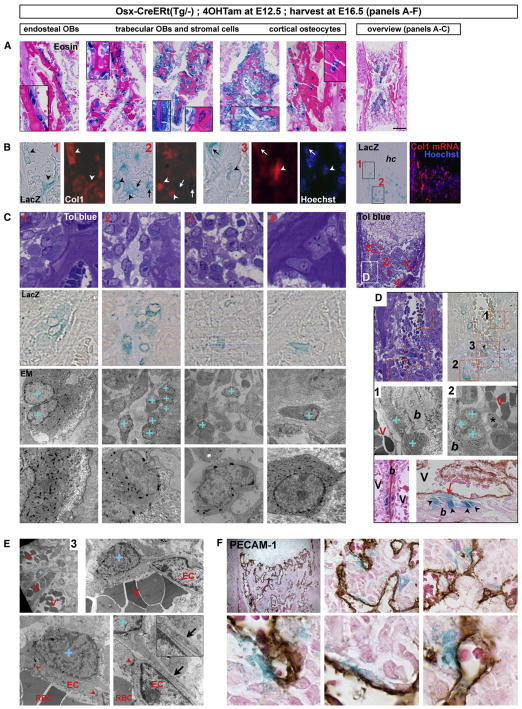
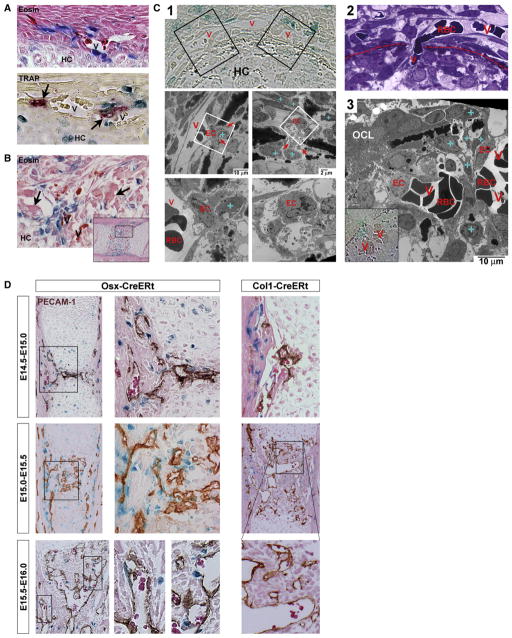
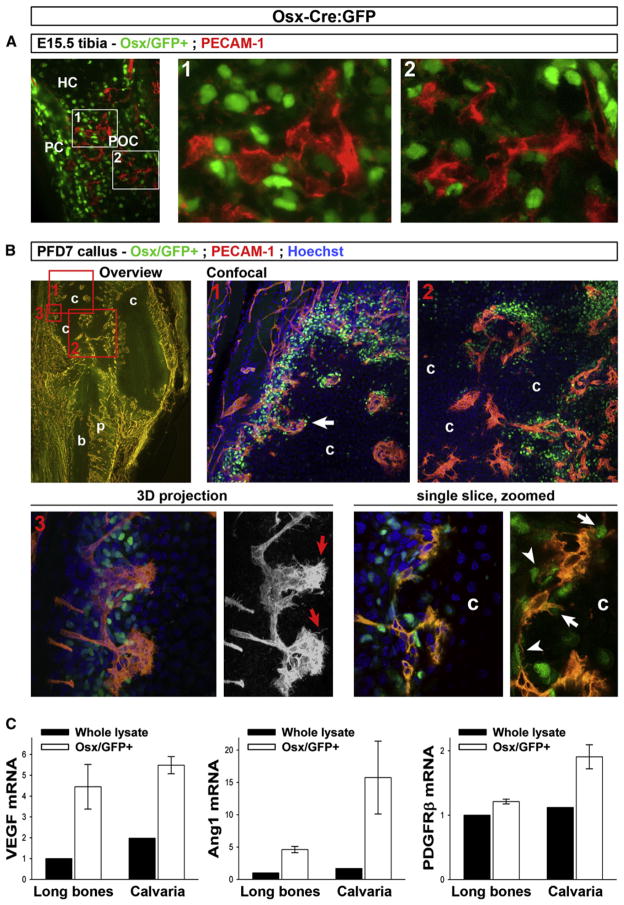
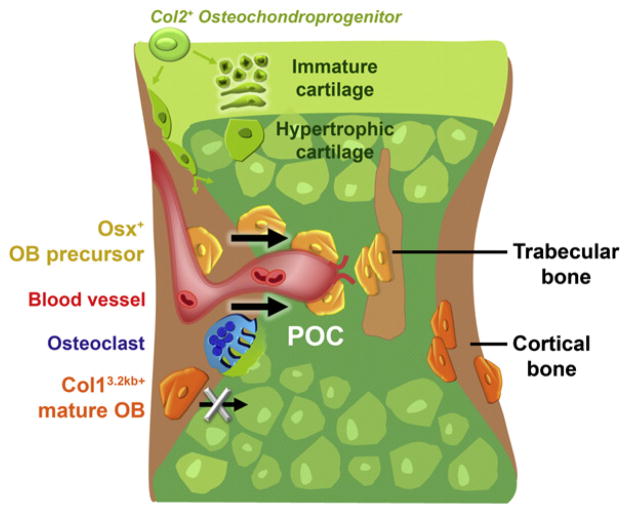
During endochondral bone development, the first osteoblasts differentiate in the perichondrium surrounding avascular cartilaginous rudiments; the source of trabecular osteoblasts inside the later bone is, however, unknown. Here, we generated tamoxifen-inducible transgenic mice bred to Rosa26R-LacZ reporter mice to follow the fates of stage-selective subsets of osteoblast lineage cells. Pulse-chase studies showed that osterix-expressing osteoblast precursors, labeled in the perichondrium prior to vascular invasion of the cartilage, give rise to trabecular osteoblasts, osteocytes, and stromal cells inside the developing bone. Throughout the translocation, some precursors were found to intimately associate with invading blood vessels, in pericyte-like fashion. A similar coinvasion occurs during endochondral healing of bone fractures. In contrast, perichondrial mature osteoblasts did not exhibit perivascular localization and remained in the outer cortex of developing bones. These findings reveal the specific involvement of immature osteoblast precursors in the coupled vascular and osteogenic transformation essential to endochondral bone development and repair.


Conflict of interest statement

All authors declare no conflicts of interest.

Figures

Figure 1
Figure 1. Transgenic Mice with Inducible CreERt Expression in Osteoblast Lineage Cells
(A) Simplified representation (top) of the line of progression of osteoblast (OB) differentiation and the typical gene product by which each stage is characterized (orange, below). The Osx-CreERt and Col1(3.2 kb)-CreERt transgenes employed in this study start to be expressed in osteoblast precursors and mature oste-oblasts, respectively. Schematic outline (bottom) of the initiation of bone formation during development, occurring between E14 and E16 in the stylopod and zeugopod bones of mice. The initial invasion of the cartilaginous bone model is associated with its transformation into the primary ossification center (POC) that contains bone trabeculae and is surrounded by cortical bone. HC, hypertrophic cartilage. (B) Whole-mount X-gal staining of E14.5 Osx-CreERt embryos carrying a Rosa26R reporter transgene. (left to right) Embryos unexposed to 4OHTam or not carrying the Osx-CreERt transgene, Alizarin red mineralization staining and corresponding pattern of LacZ activity in Osx-CreERt(Tg/−) embryos exposed to 4OHTam at E13.5. The mandible became disconnected from the embryo proper. Magnifications (right) highlight X-gal staining in the bony regions of the ribs, calvaria and hind limb (HL). (C) X-gal staining of Col1-CreERt(Tg/−) embryos harvested similarly at E14.5 after 4OHTam exposure at E13.5. Right, magnified ribs and HL. (D) E15.5 Osx- and Col1-CreERt(Tg/−) embryos injected with 4OHTam at E13.5, and magnified HL and forelimb (FL). Red arrows, reduced staining in the ribs and HL of Col1-CreERt embryos, compared with Osx-CreERt embryos. See also Figure S1 on the generation and characterization of the osteoblastic CreERt mice.
Figure 2
Figure 2. Perichondrial Osteoblast Lineage Cells Marked by Osx- or Col1-CreERt Expression Display Differential Fates in Developing Bones
(A) Osx-CreERt (top) and Col1-CreERt (bottom) humerus sections of mice pulsed with 4OHTam at E13.5 and sacrificed at E14.5 (left) or at E16.5 (right) and stained for X-gal and eosin or BrdU (far left; arrowheads indicate single LacZ+ cells, arrows point at LacZ+/BrdU+ double-positive cells). Scale bars, 100 μm. (B and C) Quantification of the perichondrial labeling (B) and the proliferation index of the labeled cells (C) in Osx- and Col1-CreERt(Tg/−) mice at E14.5. The number of LacZ+ cells and the percentage that additionally stained positive for BrdU were determined in a defined region, encompassing the central portion of the perichondrium corresponding to the black boxed area in (A). Bars, mean ± SEM; n = 3. (D and E) Distribution (D) and total number (E) of traced Osx/LacZ+ and Col1/LacZ+ cells at E16.5. Cells were counted in fixed cortical and trabecular bone areas (blue squares in A). ***p < 0.001 for comparison between genotypes; #p < 0.001 between locations. Bars, mean ± SEM; n = 5–9. See also Figure S2 on the lineage tracing kinetics of the system.
Figure 3
Figure 3. Colabeling of Osx-CreERt-Expressing Chondrocytes Does Not Contribute Detectably to the Trabecular Osteoblast Pool
(A) Growth cartilage of the proximal humerus on 3 successive days (d1–d3) after giving 4OHTam at E13.5. Osx/LacZ+ cells are detected in the (pre-)hypertrophic zones (left) at d1, but not in the round chondrocyte zone (right). Few Osx/LacZ+ hypertrophic chondrocytes remain at d2 (bracket). By d3, the cartilage is devoid of blue cells, while Osx/LacZ+ cells are abundant in the metaphysis beyond the chondro-osseous junction (asterisk-marked red bracket). (B) X-gal staining of E15.5 Col2-CreERt embryos either or not exposed to 4OHTam at E14.5. Note cartilage-confined X-gal staining, complementing Alizarin red staining. (C) Col2-CreERt humeri stained by X-gal at d1 and d3 after 4OHTam at E14.5. Note cartilage-specific labeling at d1 and a more complex staining pattern by d3, analyzed in detail in the indicated areas in (D). Scale bar, 200 μm. (D) SafraninO and eosin staining (upper left) on consecutive d1 sections showing abundant Col2/LacZ+ cells in the immature cartilage, infiltration in the hypertrophic layer (bracket), and absence from the perichondrium (red arrowheads). Increased hypertrophic and perichondrial labeling at d2 (upper right), including stretched cells near the cartilage-perichondrium interface, arranged perpendicular to the bulk of the more central chondrocytes (black arrows). (Lower panels) (d3) Area 1 (rotated) and 1′ (as indicated in C, with magnified views on the right) showing Col2/LacZ+ cells at the cartilage-perichondrium interface (arrows) and on the endosteal bone surface (arrowheads). Area 2, diffuse blue coloration at the chondro-osseous interface, likely explained by residual LacZ activity released from eroded hypertrophic chondrocytes. Area 3, central metaphyseal regions occupied by trabecular osteoblasts (arrows) and osteocytes (arrowheads) that are generally not blue. Representative sections of n = 3–7 forelimbs analyzed at 15–50 μm intervals are shown. Col2-CreERt(−/−) sections were devoid of X-gal staining (n = 2 per time point). See also Figure S3.
Figure 4
Figure 4. Perichondrial Osx/LacZ+ and Col1/LacZ+ Cells Represent Increasing Stages of Osteogenic Differentiation
(A) EM methodology. Consecutive middiaphyseal, transversal thin sections analyzed by (A1) toluidine blue, (A2) X-gal, and (A3) EM were aligned. Scale bar, 50 μm. (A4), dark accumulations of X-gal deposits (arrows) as often detected among the granular ER confirmed that blue stained cells identified on A2 could be specifically designated as X-gal+ (blue “+”) on the EM images of the consecutive section. (B) EM images of perichondrial Osx/LacZ+ cells (blue “+”) 1 day after 4OHTam-induced labeling at E13.5, appearing as loosely focally connected immature stromal cells (B1), early osteoblasts (B2 and boxes magnified in B2′ and B2′), or pericytic cells surrounding the endothelial cells (EC) of perichondrial blood vessels (V) (B3). The inset demonstrates the blue Osx/LacZ+ cell at the light microscopic level as used throughout the study as identification criterion. The high power (B3′) reveals a tight junction (arrow) between the ECs of the immature capillary lacking a basement membrane and containing RBCs. Scale bars, 2 μm. (C) Scoring analysis by EM of Osx/LacZ+ and Col1/LacZ+ cells at 12 or 24 hr after labeling at E13.5 (40–47 cells analyzed per group). (D) Representative Col1/LacZ+ cells at 12 (D1) and 24 hr (D2). V, perichondrial capillary vessels. (D1) Typically, stromal and perivascular cells (asterisks) are not labeled whereas the Col1/LacZ+ cells present as mature, cuboidal osteoblasts. (D2 and large box magnified in D2′) A Col1/LacZ+ osteocyte with cell dendrites (arrows). (D2 and small box in D2″) Mature osteoblasts. Scale bars, 2 μm. (E) Histology at E14.5 showing the relationship between E13.5-labeled LacZ+ perichondrial cells and the bone collar (Von Kossa, black). Note Osx/LacZ+ cells that are unrelated to the mineralized bone, whereas Col1/LacZ+ cells are mostly located on the bone surface (magnification) or embedded in the bone (arrow and inset). Scale bar, 50 μm. (F) E14.5 embryos exposed to 4OHTam at E12.5. Note X-gal staining in Osx- but not in Col1-CreERt hind limbs (arrows). (G) Histology of the corresponding humeri stained by Von Kossa. Col1/LacZ+ cells are only rarely found (red arrow). Scale bar, 100 μm. (H) Representative EM images of Osx/LacZ+ cells labeled at E12.5 and analyzed at E13.5, showing their appearance as immature stromal cells in the loose connective tissue, often in close juxtaposition with capillaries (V, dotted line). Inset, aligned X-gal view. Bottom, magnified view of boxed area, showing cytoplasmatic processes (arrows) and gap junctions (asterisk). (I) Morphological appearance of Osx/LacZ+ cells scored by EM analysis at 24 or 48 hr after labeling at E12.5, revealing the enrichment of immature cells (14–17 cells analyzed per group). (J) E12.5-labeled Osx/LacZ+ cell counts in the cortical and trabecular bone regions of E16.5 humeri. Bars, mean ± SEM; n = 2; ***p < 0.001. See also Figure S4.
Figure 5
Figure 5. Perichondrial Osx/LacZ+ Cells Include Osteoblast Precursors that Give Rise to Stromal Cells, Osteoblasts, and Osteocytes inside the Developing Bone, and Pericytic Cells
(A–C) Perichondrial Osx-CreERt-expressing osteoblast precursors labeled at E12.5 give rise to endosteal osteoblasts (OBs), trabecular OBs and peritrabecular stromal cells, and cortical osteocytes by E16.5. Overview sections are shown on the right. (A) Histology with magnifications in insets. Scale bar, 200 μm. (B) Col1 ISH (red signal, overlaid onto contrast or Hoechst images). Arrowheads, Osx/LacZ+ cells expressing Col1 mRNA; arrows, Col1-negative Osx/LacZ+ cells; hc, hypertrophic cartilage. Areas (1) and (2) as from boxes in the overview image; area (3) shows a cortex detail. (C) EM analysis by aligned toluidine blue, LacZ and EM views of the red boxed areas (1–4, as localized in the overview section on the right) with indication of Osx/LacZ+ cells, identified by blue staining, on the parallel EM image by a blue “+”. Bottom, magnified views; note cytoplasmic X-gal deposits in these LacZ+ cells. (D) Frequent proximity of cuboidal Osx/LacZ+ osteoblasts on mineralized bone (“+” and arrowheads) to RBC-containing blood vessels (V). Top, outline of the region (white box in (C)) and areas analyzed by EM in (D) (1–2) and (E) (3). Bottom, histology by (left) eosin or (right) additional PECAM-1 staining (brown). Note vessels running directly adjacent to Osx/LacZ+ osteoblasts (left panels), or separated only by spindle-shaped perivascular cells (asterisk), some being Osx/LacZ+ (red arrow) (right panels). (E and F) Pericytic localization of Osx/LacZ+ cells revealed by EM (E) and PECAM-1 IHC (F). (E) Overview and increasing magnifications of area 3 (see D), entry site of vessels into the diaphysis. Arrowheads, tight junctions between ECs; inset and arrow, overlapping cellular extensions of the subendothelial coverage. (F) Top, overview and magnifications of a section stained by X-gal, PECAM-1 (brown), and eosin. Bottom, detailed views of perivascular-located Osx/LacZ+ cells. See also Figure S5, providing molecular characterization of Osx-expressing cells using the Osx-Cre:GFP mouse model.
Figure 6
Figure 6. Entry of Osteoblast Precursors into Developing Bones Correlates with Their Colocalization to the Cartilage-Invading Vasculature
(A and B) Longitudinal sections stained by eosin or TRAP (A, bottom), showing Osx/LacZ+ cells colocalizing with vessels (V, containing RBCs [intense magenta on eosin]) and osteoclasts (arrows) at the time of their accumulation in the middiaphyseal perichondrium just prior to invasion of hypertrophic cartilage (HC) (A) and during the invasion (B). (C) Analysis of the initial HC invasion process using thin transverse, middiaphyseal sections. Abbreviations: V, vessel; HC, hypertrophic cartilage; EC, endothelial cell; RBC, red blood cell; blue “+”, Osx/LacZ+ cell; OCL, osteoclast. (C1) X-gal view (top) identifying Osx/LacZ+ cells and (below) aligned EM images corresponding to the black boxes on the left and right, respectively. Further magnifications from the respective white boxes are shown below each panel. Note initiation of cartilage invasion with bone-collar-transversing ECs displaying abundant filopodia extensions (red arrows), indicative of sprouting angiogenesis. (C2) Toluidine blue picture of a RBC-filled vessel transversing the bone collar (dotted line). (C3) RBC-filled capillaries budding into the cartilage, interspersed with Osx/LacZ+ cells. (D) PECAM-1 stained Osx-CreERt and Col1-CreERt humeri at the indicated time points. Osx-CreERt embryos were exposed to 4OHTam at E12.5 or E13.5 in (A)–(D), Col1-CreERt mice received 4OHTam at E13.5. See Figure S6 on the role of osteoclasts in initial invasion.
Figure 7
Figure 7. Simultaneous Osteoblastic and Angiogenic Invasion of Cartilage in Healing Fractures
(A) PECAM-1 IHC on frozen E15.5 Osx-Cre:GFP tibia sections revealing Osx/GFP+ cells (green, note predominant nuclear localization of the Cre:GFP fusion protein) and endothelium (red) during the initial invasion of the hypertrophic cartilage (HC) and primary ossification center (POC) formation. PC, perichondrium. Right, magnified views of indicated areas. (B) Thick section analysis of fractured tibia of Osx-Cre:GFP mice at postfracture day (PFD) 7, stained with PECAM-1 antibodies (red) and Hoechst (blue). Top row, overview of the callus at 5× by standard microscopy (left; yellow, vasculature; dark areas, cartilage [c] and cortical bone [b]; p, periosteum) indicating the areas (boxes 1–3) analyzed by confocal microscopy. Right panels, areas 1 and 2, showing projections of sets of stacked images taken with a 20× objective (also see Movies S1–S3). Bottom left, area 3, showing 3D projection of 60× confocal images (also see Movie S4). The 3D red channel (PECAM-1 signal) is also shown separately (black/white view), revealing the endothelial filopodia at the invasion front (red arrows). Bottom right, single optical slice extracted from the 60× stack, and enlarged detail omitting the blue channel signal for optimal appreciation of the Osx/GFP+ nuclei. Note abundant Osx/GFP+ cells immediately juxtaposing the endothelial lining (arrowheads) and tips at the invasion front (arrows). (C) qRT-PCR analysis of VEGF, Ang1, and PDGFRβ in Osx/GFP+ sorted cell populations (mean ± SEM; n = 4) derived from collagenase-digested calvaria or long bones from newborn Osx-Cre:GFP mice, as compared with control digests of Osx-Cre:GFP-negative littermates (“whole lysate”). Video files (Movies S1–S4) of the stacked confocal images and data on other time points during the fracture healing process are provided in Figure S7.
Figure 8
Figure 8. Model Summarizing Our Findings
Schematic outline of the events taking place during the initial invasion of the cartilaginous bone model and its transformation into the primary ossification center (POC). Col2-expressing chondro-perichondrial progenitors (green) give rise to cells in the central growth cartilage and to transversally oriented cells at the periphery with presumed perichondrial/osteoblastic fates. The first committed osteoblast lineage cells appear in the perichondrium surrounding the middiaphyseal hypertrophic cartilage. The cells display differential destinies in the developing bone depending on their stage of maturation. Early cells of the lineage, represented by the Osx-expressing osteoblast precursors (Osx/LacZ+, yellow), move into the developing POC and populate it as stromal cells or differentiate further to become bone-forming trabecular osteoblasts. The entrance of the osteoblast precursors into the POC coincides with the initial invasion by blood vessels (red) and osteoclasts (blue), and is associated with a pericytic localization of a subset of the precursors onto the endothelium. In contrast, cells that differentiated to the stage of Col1 (3.2 kb) expression within the perichondrium/periosteum (Col1/LacZ+ mature osteoblasts, orange) are not found in vessel-covering positions and do not have the capacity to translocate into the POC. These osteoblasts are retained on and within the cortical bone surfaces.

Comment in

Similar articles

Cited by

References

    1. Bianco P, Cancedda FD, Riminucci M, Cancedda R. Bone formation via cartilage models: the “borderline” chondrocyte. Matrix Biol. 1998;17:185–192. - PubMed
    1. Colnot C, Lu C, Hu D, Helms JA. Distinguishing the contributions of the perichondrium, cartilage, and vascular endothelium to skeletal development. Dev Biol. 2004;269:55–69. - PubMed
    1. Colnot C, de la Fuente L, Huang S, Hu D, Lu C, St-Jacques B, Helms JA. Indian hedgehog synchronizes skeletal angiogenesis and perichondrial maturation with cartilage development. Development. 2005;132:1057–1067. - PubMed
    1. Feil R, Brocard J, Mascrez B, LeMeur M, Metzger D, Chambon P. Ligand-activated site-specific recombination in mice. Proc Natl Acad Sci USA. 1996;93:10887–10890. - PMC - PubMed
    1. Galotto M, Campanile G, Robino G, Cancedda FD, Bianco P, Cancedda R. Hypertrophic chondrocytes undergo further differentiation to osteoblast-like cells and participate in the initial bone formation in developing chick embryo. J Bone Miner Res. 1994;9:1239–1249. - PubMed

Publication types

MeSH terms