

doi: 10.1016/j.yebeh.2010.06.009.
Epub 2010 Aug 13.
Controversies in epilepsy: debates held during the Fourth International Workshop on Seizure Prediction
Affiliations
- PMID: 20708976
- PMCID: PMC2943379
- DOI: 10.1016/j.yebeh.2010.06.009
Item in Clipboard
Controversies in epilepsy: debates held during the Fourth International Workshop on Seizure Prediction
Epilepsy Behav.
2010 Sep.
Abstract
Debates on six controversial topics were held during the Fourth International Workshop on Seizure Prediction (IWSP4) convened in Kansas City, KS, USA, July 4-7, 2009. The topics were (1) Ictogenesis: Focus versus Network? (2) Spikes and Seizures: Step-relatives or Siblings? (3) Ictogenesis: A Result of Hyposynchrony? (4) Can Focal Seizures Be Caused by Excessive Inhibition? (5) Do High-Frequency Oscillations Provide Relevant Independent Information? (6) Phase Synchronization: Is It Worthwhile as Measured? This article, written by the IWSP4 organizing committee and the debaters, summarizes the arguments presented during the debates.
Copyright © 2010 Elsevier Inc. All rights reserved.
Figures
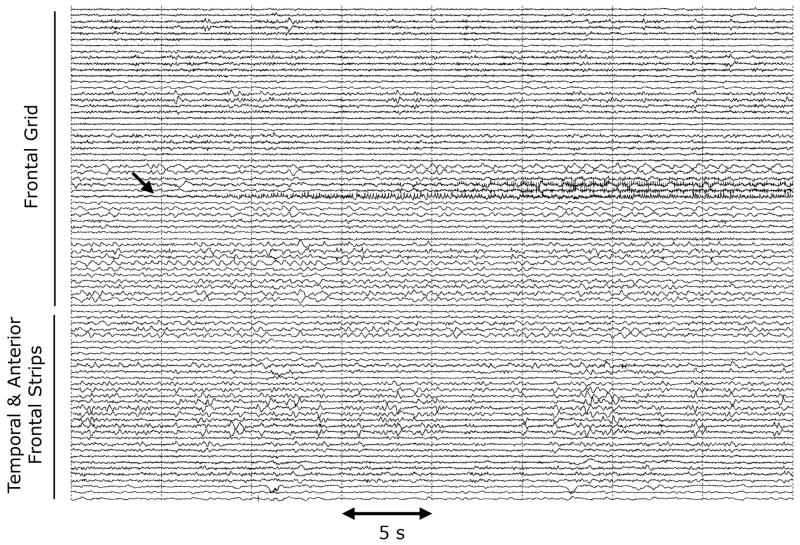
Intracranial EEG (ICEEG) of a partial seizure onset in a patient with a calcified frontal vascular malformation. The initial ~35 sec of the focal onset of the seizure is shown.
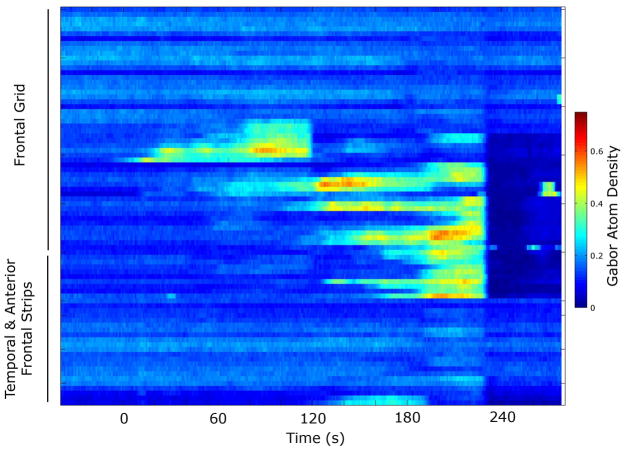
Propagation map for the entire focal seizure illustrated in Figure 1. Each channel represents the composite GAD measure of complexity. Blue represents low GAD values and red represents high GAD values. This illustrates the focal onset from the frontal region but also during this 5 minute analysis, the patterns of propagation distinct from the focus are appreciated. Time 0 is the approximate seizure onset.
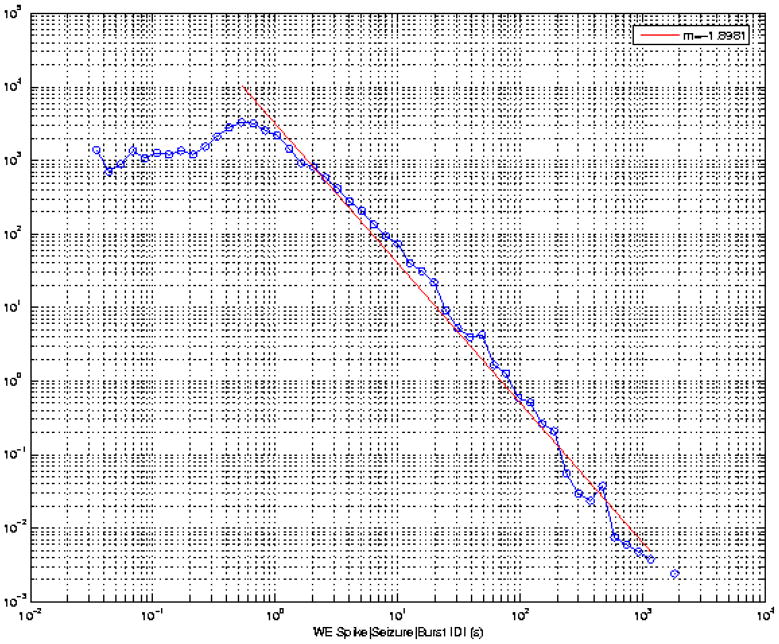
Doubly logarithmic plots (y-axis: number of intervals; x-axis: durations in sec.) of times elapsed between the onset of events (defined as a single spike, bursts of spikes or seizures) recorded directly from the cortex of 8 rats treated intravenously with 3 mercapto-propionic acid. Onset times were marked visually. Inter-event (single spikes, bursts of spikes and seizures) time intervals are governed by the same power law suggesting they share common dynamics.
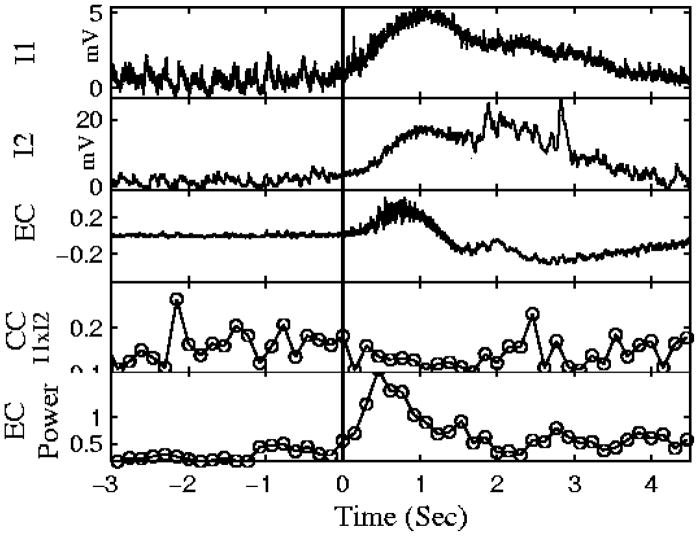
Simultaneous recording of two intracellular (I1 & I2, top two signals) and extracellular recording (EC, third trace from top) during 4-AP induced seizures in slice. Crosscorrelation (CC) measured in short time bins during the seizure show that while both neurons are strongly depolarized during the seizure, the high frequency activity is not correlated. Towards the end of the seizure, correlation begins to increase again. Figure modified from [22].
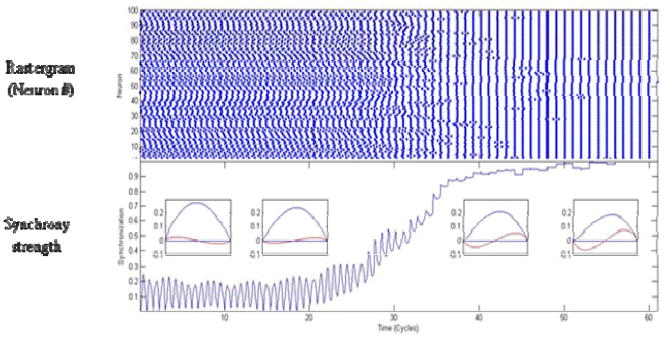
Excitatory network to desynchronize and then synchronize as network activity decreases. Network of 100 excitatory cells all-to-all coupled. Top graph, rastergram of spike times. Middle panel, spectrogram of network activity, light colors indicate strong synchrony. Bottom panel, a network synchrony measure, zero is desynchronized, 1 is perfect synchrony. Phase response curves are being changed over simulation, insets show PRC and H functions (red sinusoid) at 4 time points. The change in PRC is designed to reflect that seen from decreasing firing rate. Network switches from splay to stable synchrony on 15th cycle.
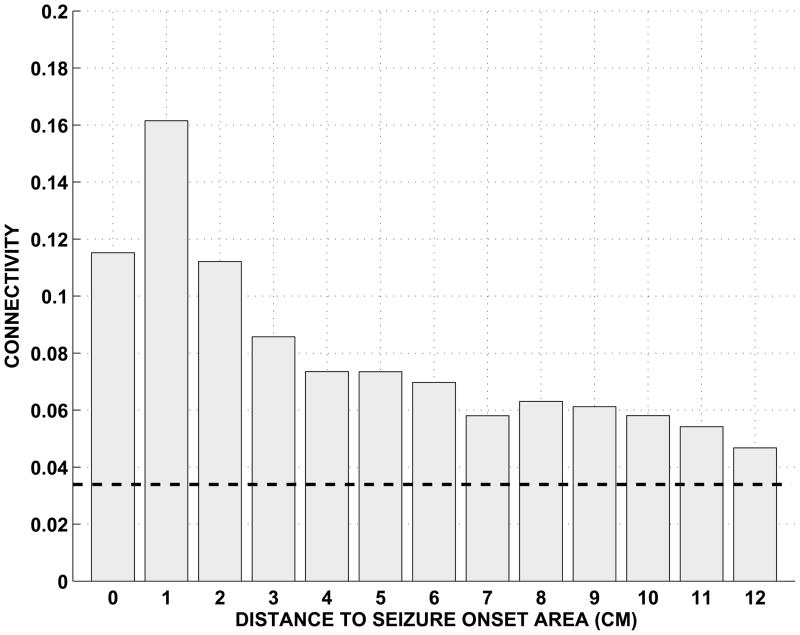
Intracranial EEG beta frequency band connectivity averaged for 6 unselected patients for integer distances from the seizure onset area [33]. The seizure onset contacts are located at distance 0. Average estimates greater than the indicated threshold are significantly non-zero (p < 10−5). Non-zero connectivity exists in the seizure onset area and several cm away from it, and an inverse relationship is apparent between average beta band connectivity and distance from the seizure onset area. Reproduced, with permission, from [33].
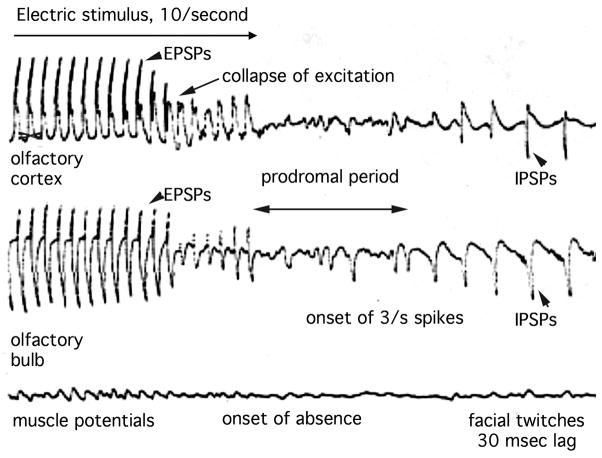
At high temporal resolution it can be seen that the seizure begins with the failure of excitation. The presynaptic compound action potential was unchanged, ergo the failure was due to depletion of glutamate in the presynaptic terminals from excessive utilization rate. It then becomes obvious that the seizure spikes are IPSPs, not EPSPs, because they have the same spatial distribution with overlap of the location of the active synapses on the pyramidal cells, but with opposite polarity.
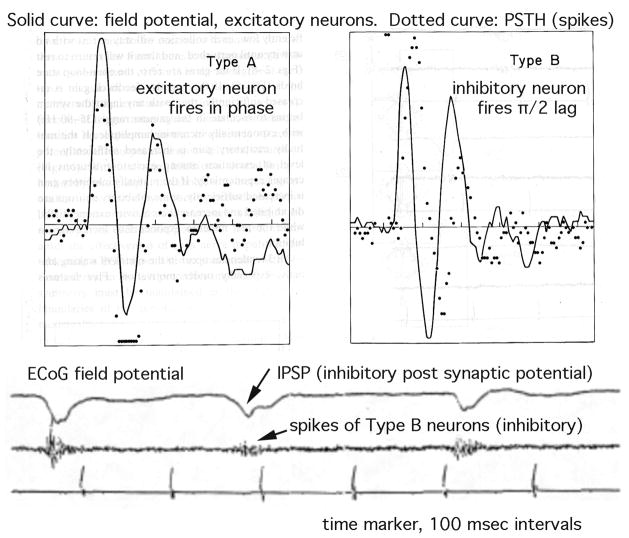
In prepyriform cortex the IPSP of the excitatory neurons (A) is accompanied by vigorous discharge of interneurons, as identified by the 90° phase lag (B).
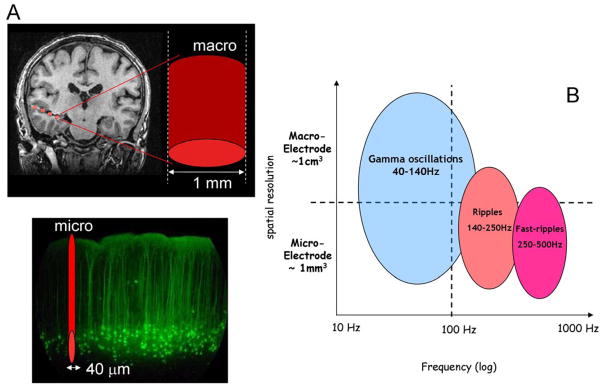
Macro and micro recordings of HFOs in the human brain. (A) Conventional intracranial depth macroelectrodes have a contact area around 1 mm2, which presumably record the activity of ~10 mm square of brain tissue. Microelectrodes are capable of probing the fine structure of cerebral cortex have and have a typical size of 30–40 μm in diameter. (B) The spatial scale of the expression of physiological HFO in the gamma (40 – 120 Hz) and ripple frequency (140 – 250 Hz) range and pathological fast ripple (250 – 500 Hz) HFO is frequency dependent (Adapted from [64]).
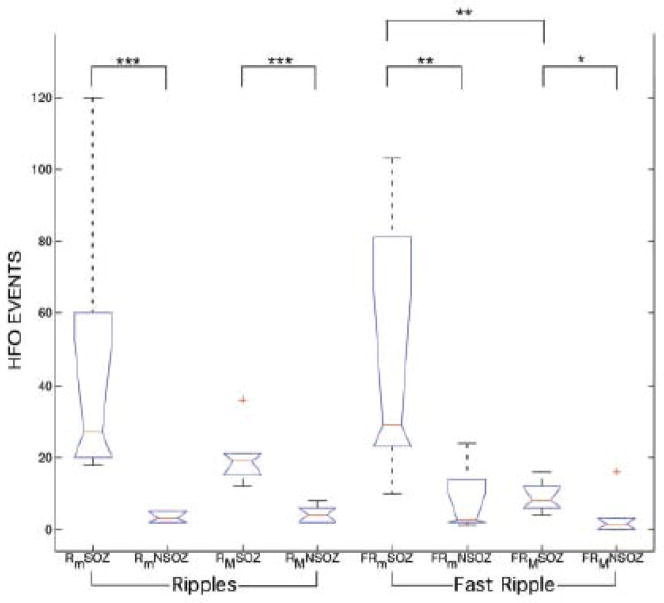
Analysis of variance applied to HFO (ripple/FR), electrode (micro/macroelectrode) and brain region (seizure onset/non-seizure onset). The number of microwire ripple (Rm) and fast ripple (FRm) oscillations are increased in the seizure onset zone (SOZ) compared to non-SOZ. The number of macroelectrode ripple (RM) and fast ripple (FRM) oscillations were increased in the SOZ. The microwire electrodes detect significantly more fast-ripple HFO compared to the clinical macroelectrodes (Adapted from [70]).
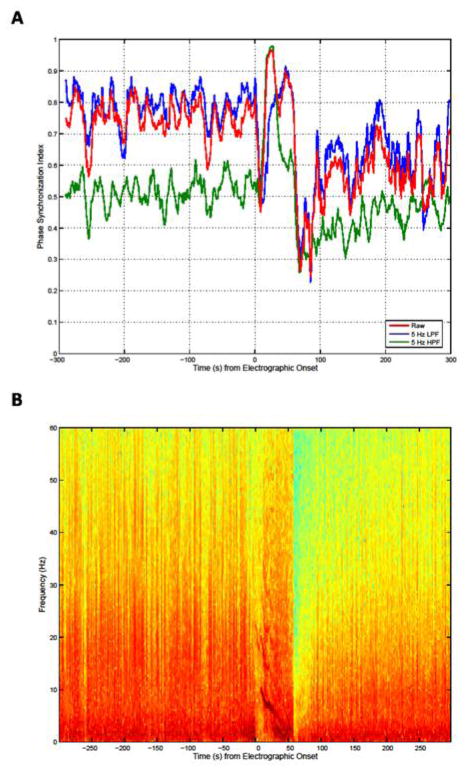
(A) Phase synchronization between two intracranial channels (bipolar montage) during a seizure recording. The seizure started at 0 s and lasted for approximately 60 s. Displayed is the time course of the mean phase coherence calculated from the raw broad band signals (red), from low-pass filtered signals below 5 Hz (blue), and from high-pass filtered signals. Note that the broad-band synchronization index mostly follows the low-pass-filtered index except during seizure onset when it briefly follows the high-pass-filtered index. (B) The time-frequency plot with the color-coded spectral power from one of the two channels shows that the dominant frequency is mostly below 5 Hz except during seizure onset when the dominant frequency is briefly found around 10 Hz. (Analysis and Figure provided by Mark Frei.)
Similar articles
-
Controversies on the network theory of epilepsy: Debates held during the ICTALS 2019 conference.Seizure. 2020 May;78:78-85. doi: 10.1016/j.seizure.2020.03.010. Epub 2020 Mar 19. Seizure. 2020. PMID: 32272333 Free PMC article. Review.
-
Seizure prediction: the Fourth International Workshop.Epilepsy Behav. 2010 Sep;19(1):1-3. doi: 10.1016/j.yebeh.2010.06.008. Epub 2010 Aug 2. Epilepsy Behav. 2010. PMID: 20674508 Free PMC article.
-
Epileptic seizure prediction using phase synchronization based on bivariate empirical mode decomposition.Clin Neurophysiol. 2014 Jun;125(6):1104-11. doi: 10.1016/j.clinph.2013.09.047. Epub 2013 Nov 15. Clin Neurophysiol. 2014. PMID: 24296277
-
The First International Collaborative Workshop on Seizure Prediction: summary and data description.Clin Neurophysiol. 2005 Mar;116(3):493-505. doi: 10.1016/j.clinph.2004.08.020. Epub 2005 Jan 5. Clin Neurophysiol. 2005. PMID: 15721063
-
Interictal oscillations and focal epileptic disorders.Eur J Neurosci. 2018 Oct;48(8):2915-2927. doi: 10.1111/ejn.13628. Epub 2017 Jul 18. Eur J Neurosci. 2018. PMID: 28644911 Review.
Cited by
-
The present and future of seizure detection, prediction, and forecasting with machine learning, including the future impact on clinical trials.Front Neurol. 2024 Jul 11;15:1425490. doi: 10.3389/fneur.2024.1425490. eCollection 2024. Front Neurol. 2024. PMID: 39055320 Free PMC article. Review.
-
Weighted and directed interactions in evolving large-scale epileptic brain networks.Sci Rep. 2016 Oct 6;6:34824. doi: 10.1038/srep34824. Sci Rep. 2016. PMID: 27708381 Free PMC article.
-
A systems-level approach to human epileptic seizures.Neuroinformatics. 2013 Apr;11(2):159-73. doi: 10.1007/s12021-012-9161-2. Neuroinformatics. 2013. PMID: 22961601
-
Increased Intrinsic Connectivity of the Default Mode Network in Temporal Lobe Epilepsy: Evidence from Resting-State MEG Recordings.PLoS One. 2015 Jun 2;10(6):e0128787. doi: 10.1371/journal.pone.0128787. eCollection 2015. PLoS One. 2015. PMID: 26035750 Free PMC article.
-
Autapses promote synchronization in neuronal networks.Sci Rep. 2018 Jan 12;8(1):580. doi: 10.1038/s41598-017-19028-9. Sci Rep. 2018. PMID: 29330551 Free PMC article.
References
-
- Engel J., Jr Report of the ILAE Classification Core Group. Epilepsia. 2006;47:1558–1568. - PubMed
-
- Franaszczuk PJ, Bergey GK, Durka PJ, Eisenberg HM. Time-Frequency analysis using the matching pursuit algorithm applied to seizures originating from the mesial temporal lobe. Electroenceph clin Neurophysiol. 1998;106:513–21. - PubMed
-
- Tonini C, Beghi E, Berg AT, Bogliun G, Giordano L, Newton RW, Tetto A, Vitelli E, Vitezic D, Wiebe S. Predictors of epilepsy surgery outcome: a meta-analysis. Epilepsy Res. 2004;62:75–87. - PubMed
-
- Avoli M, Antuono MD, Louvel J, Köhling R, Biagini G, Pumain R, Arcangelo GD, Tancredi V. Network and pharmacological mechanisms leading to epileptiform synchronization in the limbic system in vitro. Prog Neurobiol. 2002;68:167–207. - PubMed
