

Quantitative proteomic analysis of ribosome assembly and turnover in vivo
- PMID: 20709079
- PMCID: PMC2953596
- DOI: 10.1016/j.jmb.2010.08.005
Quantitative proteomic analysis of ribosome assembly and turnover in vivo
Abstract
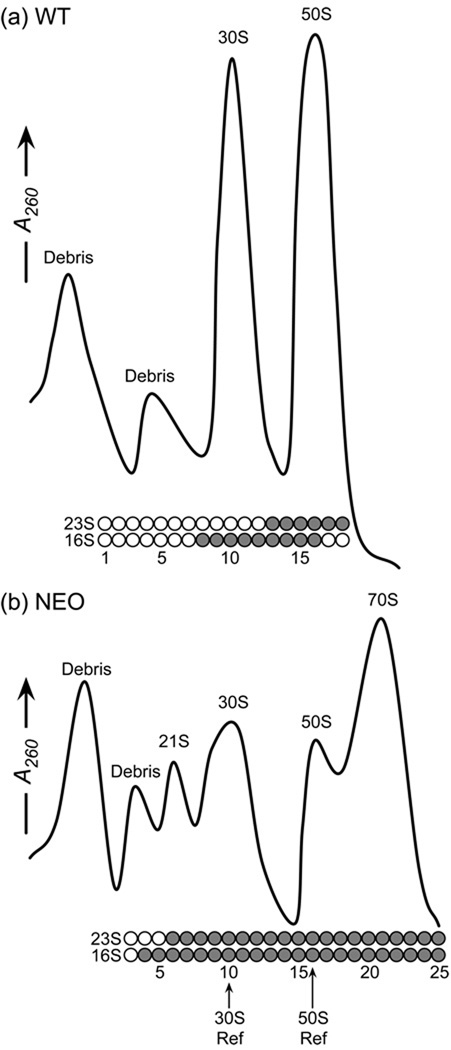
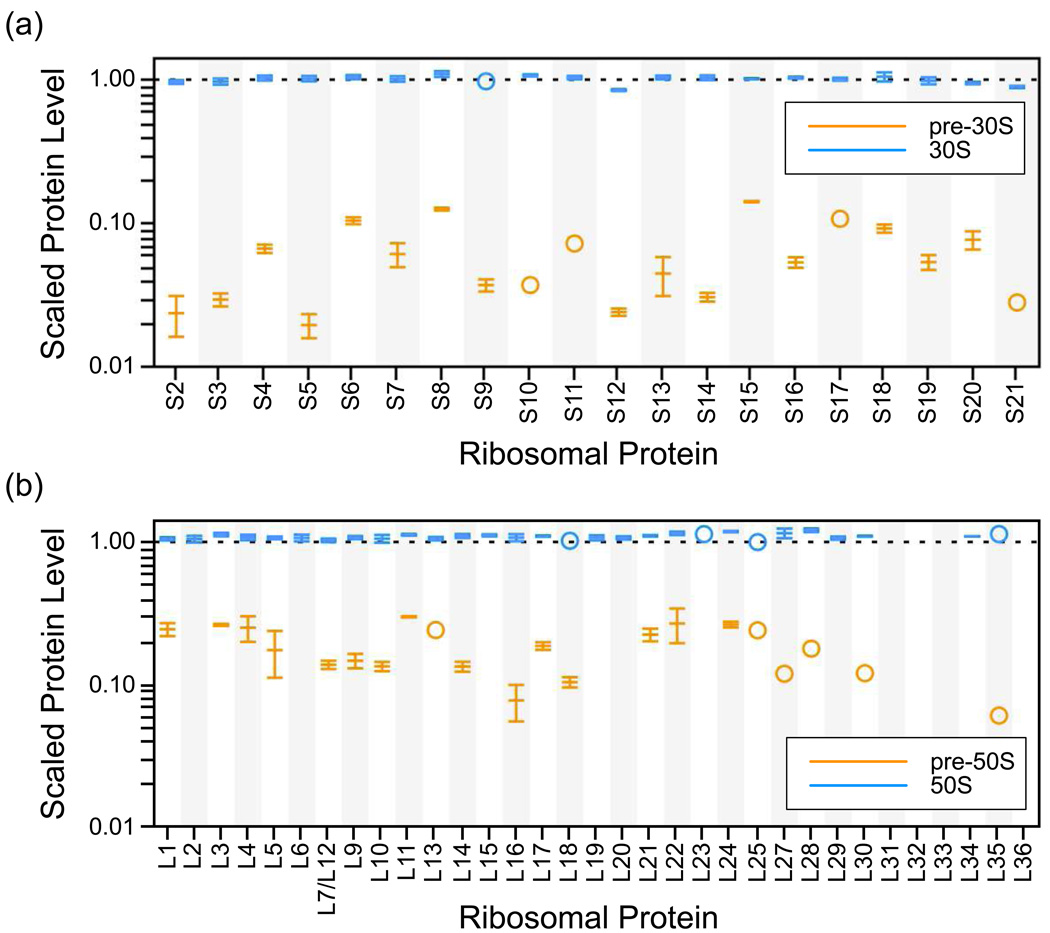
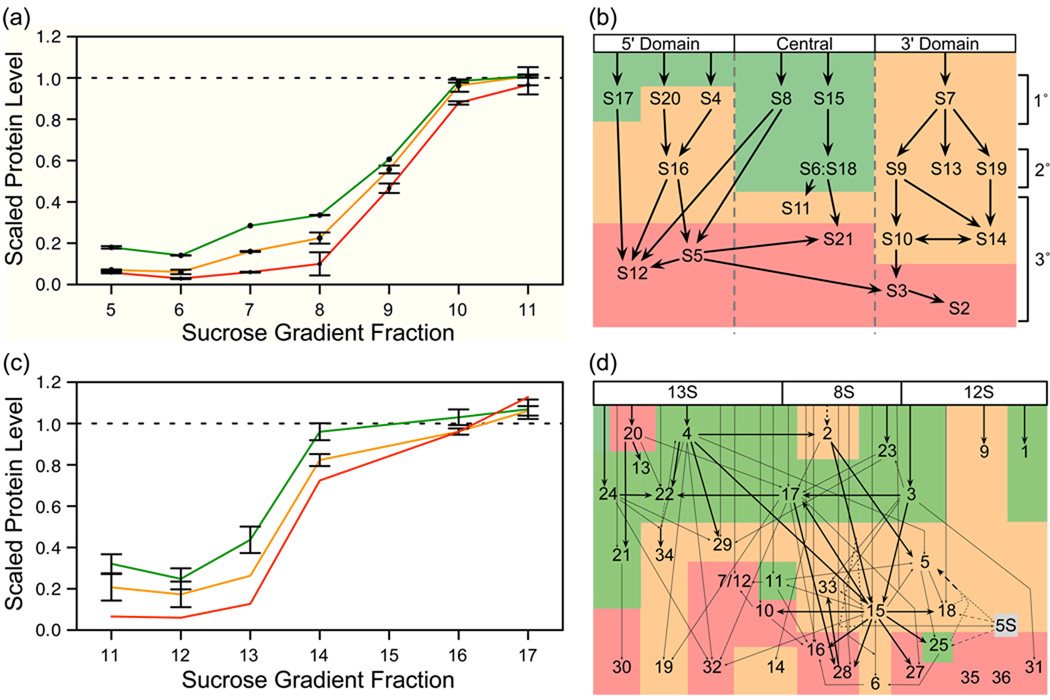
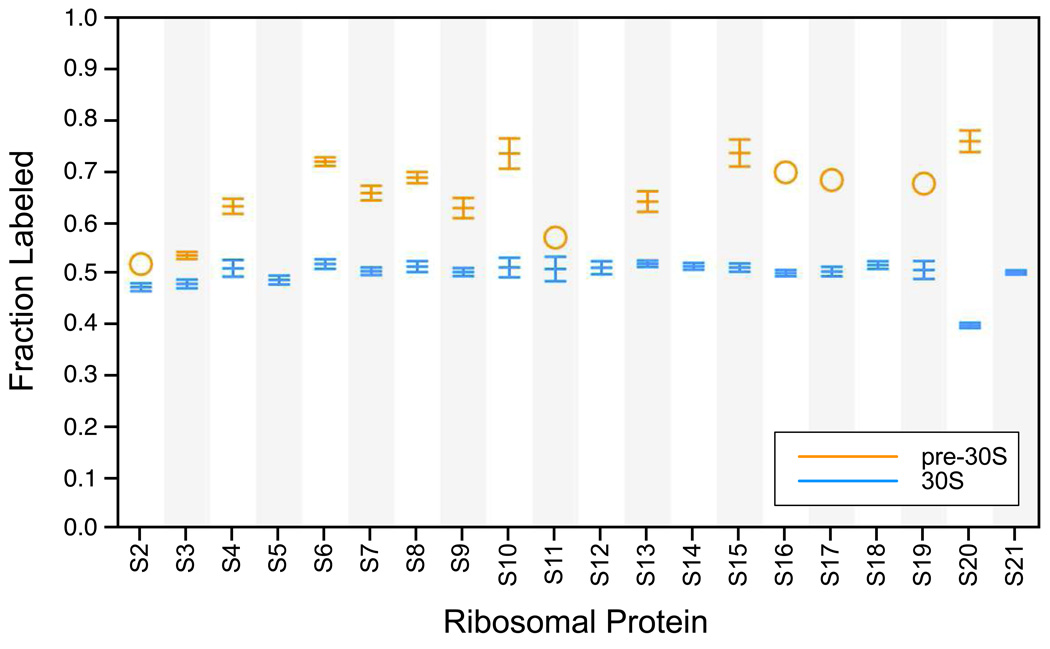
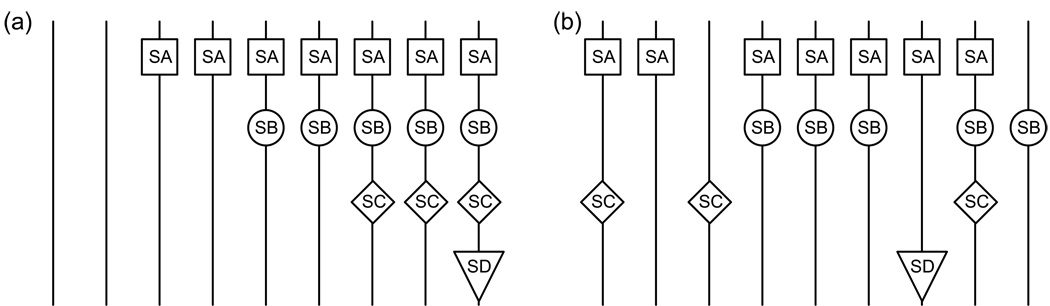
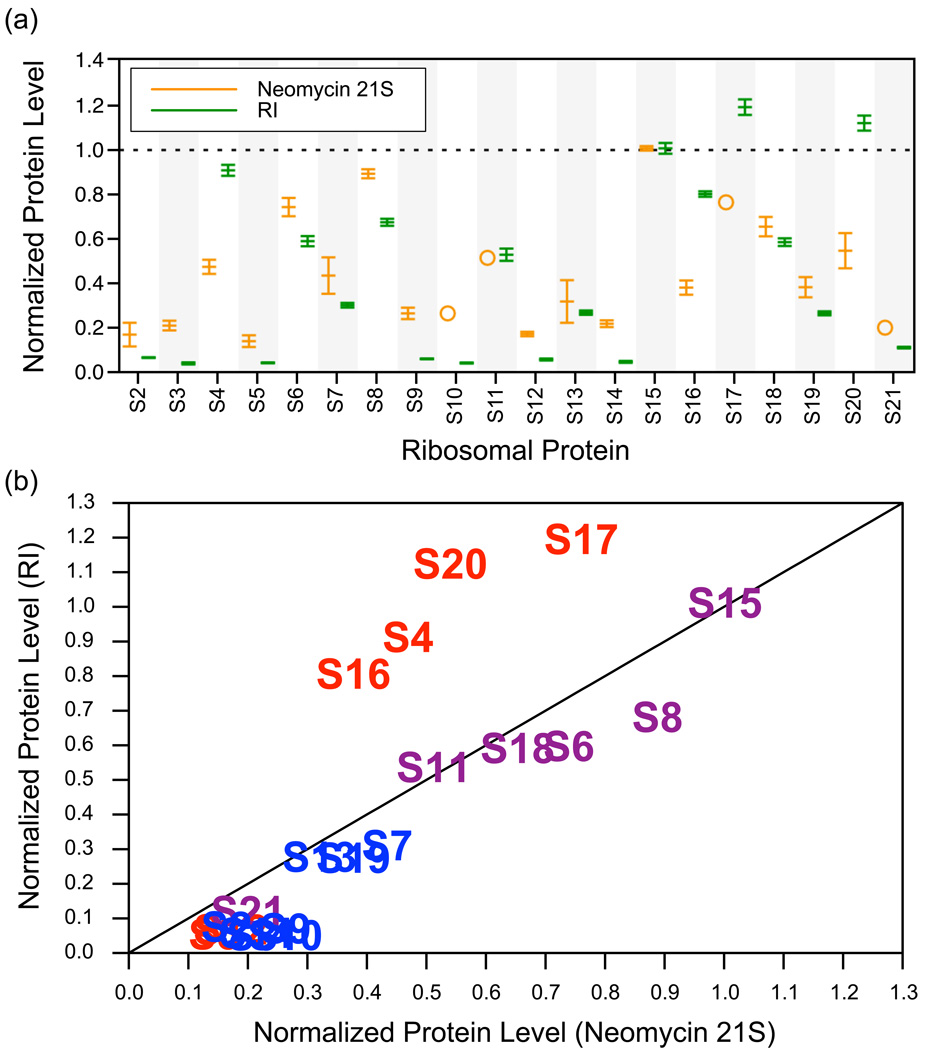
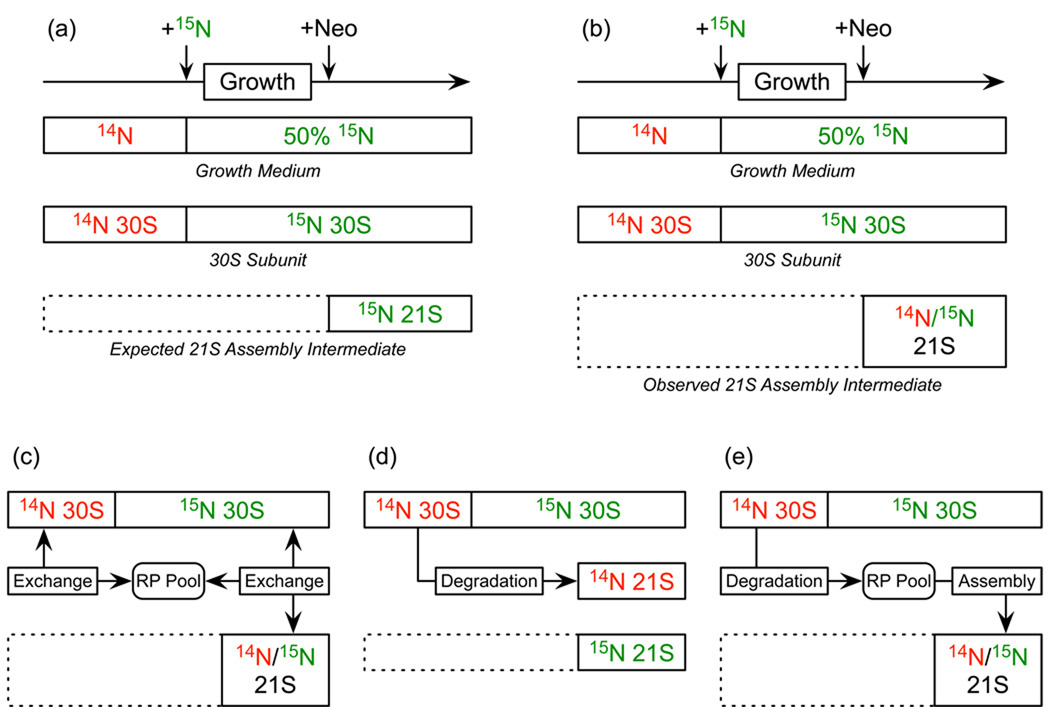
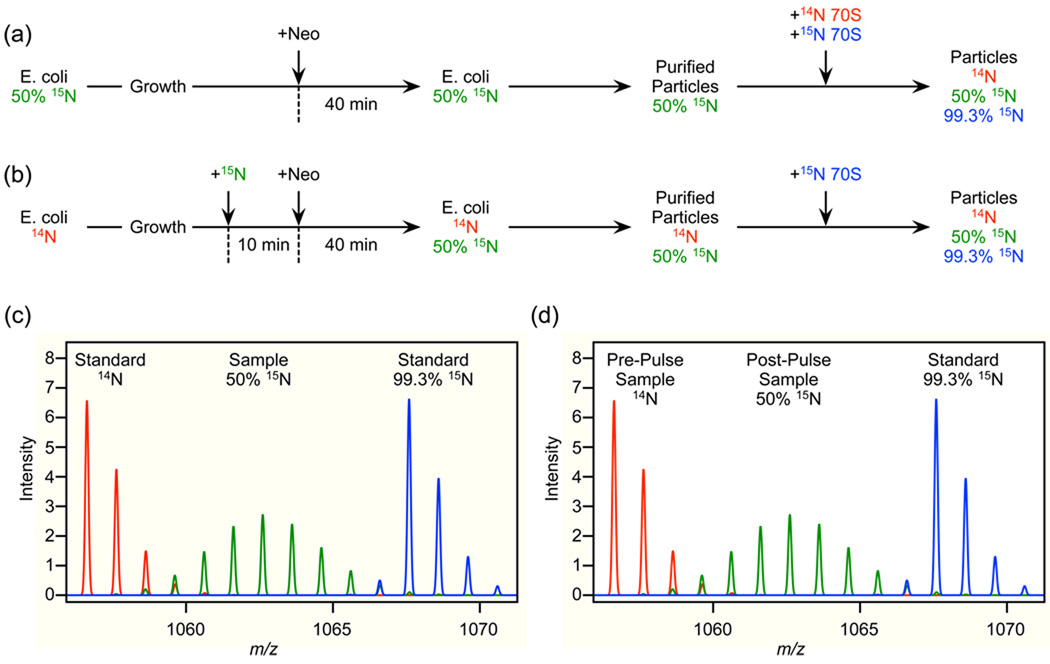
Although high-resolution structures of the ribosome have been solved in a series of functional states, relatively little is known about how the ribosome assembles, particularly in vivo. Here, a general method is presented for studying the dynamics of ribosome assembly and ribosomal assembly intermediates. Since significant quantities of assembly intermediates are not present under normal growth conditions, the antibiotic neomycin is used to perturb wild-type Escherichia coli. Treatment of E. coli with the antibiotic neomycin results in the accumulation of a continuum of assembly intermediates for both the 30S and 50S subunits. The protein composition and the protein stoichiometry of these intermediates were determined by quantitative mass spectrometry using purified unlabeled and (15)N-labeled wild-type ribosomes as external standards. The intermediates throughout the continuum are heterogeneous and are largely depleted of late-binding proteins. Pulse-labeling with (15)N-labeled medium time-stamps the ribosomal proteins based on their time of synthesis. The assembly intermediates contain both newly synthesized proteins and proteins that originated in previously synthesized intact subunits. This observation requires either a significant amount of ribosome degradation or the exchange or reuse of ribosomal proteins. These specific methods can be applied to any system where ribosomal assembly intermediates accumulate, including strains with deletions or mutations of assembly factors. This general approach can be applied to study the dynamics of assembly and turnover of other macromolecular complexes that can be isolated from cells.
Copyright © 2010 Elsevier Ltd. All rights reserved.
Figures
Comment in
-
Taking the pulse of ribosome assembly in vivo.J Mol Biol. 2010 Oct 29;403(3):329-30. doi: 10.1016/j.jmb.2010.09.011. Epub 2010 Sep 15. J Mol Biol. 2010. PMID: 20833184 No abstract available.
Similar articles
-
Characterization of the ribosome biogenesis landscape in E. coli using quantitative mass spectrometry.J Mol Biol. 2013 Feb 22;425(4):767-79. doi: 10.1016/j.jmb.2012.11.040. Epub 2012 Dec 7. J Mol Biol. 2013. PMID: 23228329 Free PMC article.
-
Measuring the dynamics of E. coli ribosome biogenesis using pulse-labeling and quantitative mass spectrometry.Mol Biosyst. 2012 Oct 30;8(12):3325-34. doi: 10.1039/c2mb25310k. Mol Biosyst. 2012. PMID: 23090316 Free PMC article.
-
Fluorescence-based monitoring of ribosome assembly landscapes.BMC Mol Biol. 2015 Feb 25;16:3. doi: 10.1186/s12867-015-0031-y. BMC Mol Biol. 2015. PMID: 25884162 Free PMC article.
-
[Ribosome: lessons of a molecular factory construction].Mol Biol (Mosk). 2014 Jul-Aug;48(4):543-60. Mol Biol (Mosk). 2014. PMID: 25842841 Review. Russian.
-
Assembly of bacterial ribosomes.Annu Rev Biochem. 2011;80:501-26. doi: 10.1146/annurev-biochem-062608-160432. Annu Rev Biochem. 2011. PMID: 21529161 Review.
Cited by
-
Saccharomyces cerevisiae ribosomal protein L26 is not essential for ribosome assembly and function.Mol Cell Biol. 2012 Aug;32(16):3228-41. doi: 10.1128/MCB.00539-12. Epub 2012 Jun 11. Mol Cell Biol. 2012. PMID: 22688513 Free PMC article.
-
Nonessential plastid-encoded ribosomal proteins in tobacco: a developmental role for plastid translation and implications for reductive genome evolution.Plant Cell. 2011 Sep;23(9):3137-55. doi: 10.1105/tpc.111.088906. Epub 2011 Sep 20. Plant Cell. 2011. PMID: 21934145 Free PMC article.
-
Seed-Stored mRNAs that Are Specifically Associated to Monosomes Are Translationally Regulated during Germination.Plant Physiol. 2020 Jan;182(1):378-392. doi: 10.1104/pp.19.00644. Epub 2019 Sep 16. Plant Physiol. 2020. PMID: 31527088 Free PMC article.
-
Chemical modulators of ribosome biogenesis as biological probes.Nat Chem Biol. 2015 Dec;11(12):924-32. doi: 10.1038/nchembio.1957. Epub 2015 Nov 17. Nat Chem Biol. 2015. PMID: 26575239
-
Structural insights into the assembly of the 30S ribosomal subunit in vivo: functional role of S5 and location of the 17S rRNA precursor sequence.Protein Cell. 2014 May;5(5):394-407. doi: 10.1007/s13238-014-0044-1. Epub 2014 Mar 28. Protein Cell. 2014. PMID: 24671761 Free PMC article.
References
-
- Schuwirth BS, Borovinskaya MA, Hau CW, Zhang W, Vila-Sanjurjo A, Holton JM, Cate JHD. Structures of the bacterial ribosome at 3.5 A resolution. Science. 2005;310:827–834. - PubMed
-
- Selmer M, Dunham CM, Murphy FV, Weixlbaumer A, Petry S, Kelley AC, Weir JR, Ramakrishnan V. Structure of the 70S ribosome complexed with mRNA and tRNA. Science. 2006;313:1935–1942. - PubMed
-
- Korostelev A, Trakhanov S, Laurberg M, Noller HF. Crystal structure of a 70S ribosome-tRNA complex reveals functional interactions and rearrangements. Cell. 2006;126:1065–1077. - PubMed
-
- Mizushima S, Nomura M. Assembly mapping of 30S ribosomal proteins from E. coli. Nature. 1970;226:1214–1218. - PubMed
-
- Nomura M. Assembly of bacterial ribosomes. Science. 1973;179:864–873. - PubMed
Publication types
MeSH terms
Substances
Grants and funding
LinkOut - more resources
Full Text Sources
