

Harmonic pitch: dependence on resolved partials, spectral edges, and combination tones
- PMID: 20709166
- PMCID: PMC3703502
- DOI: 10.1016/j.heares.2010.08.002
Harmonic pitch: dependence on resolved partials, spectral edges, and combination tones
Abstract
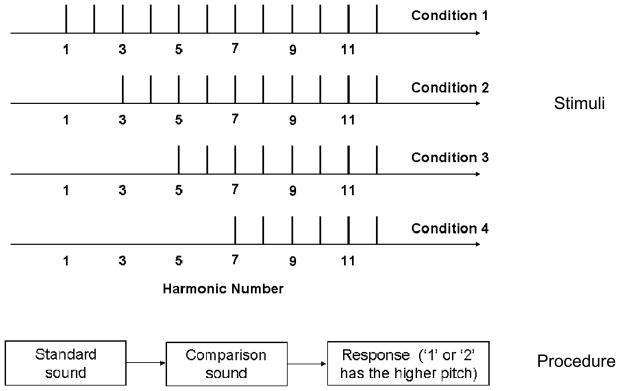
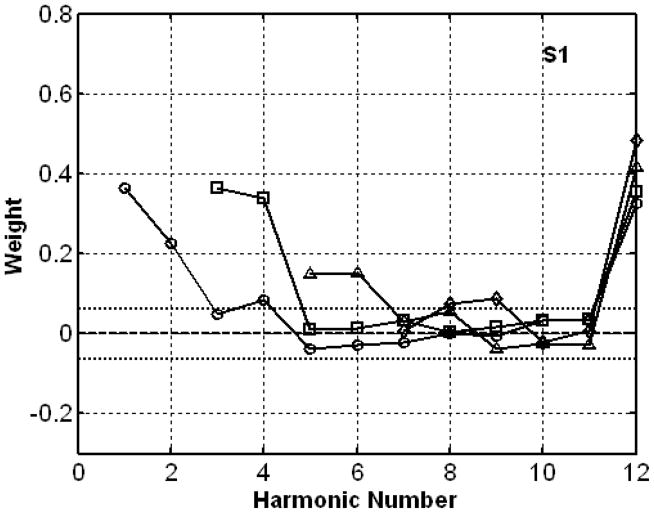
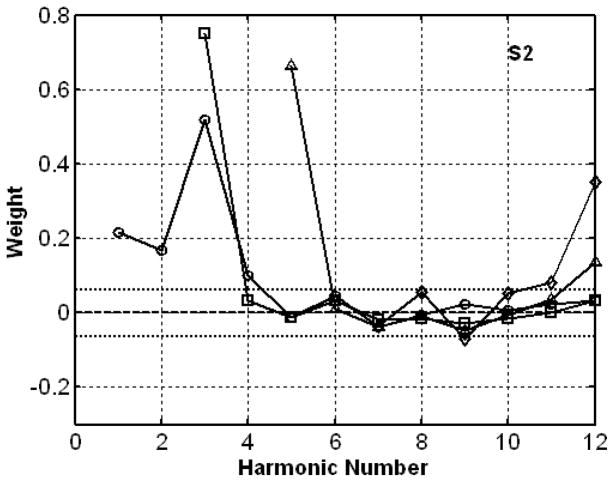
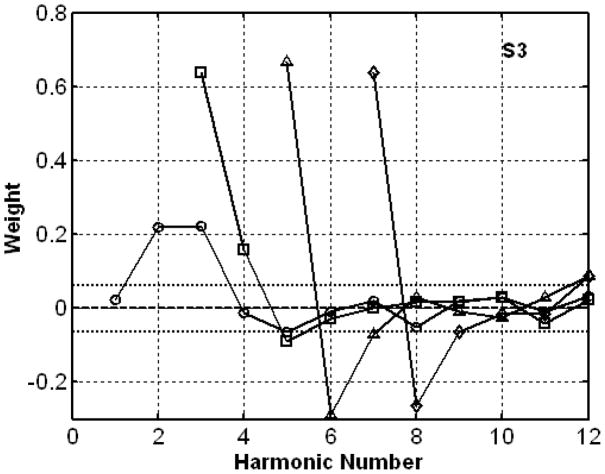
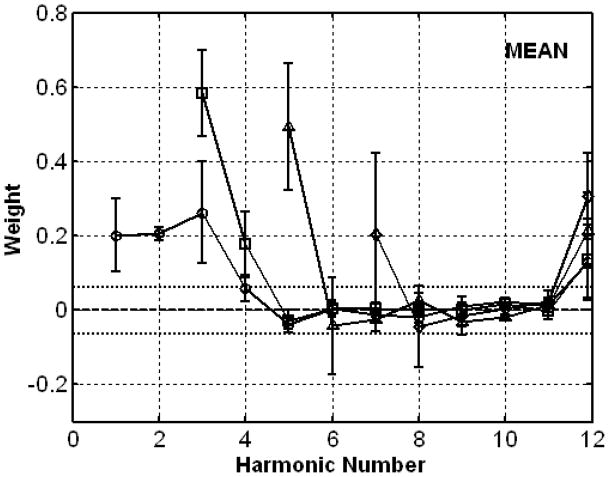
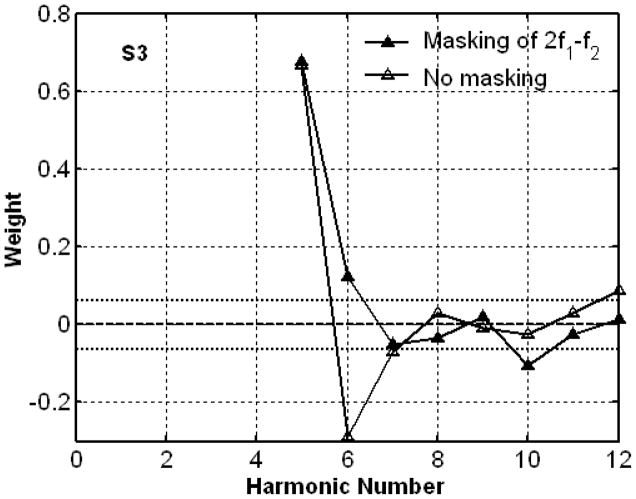
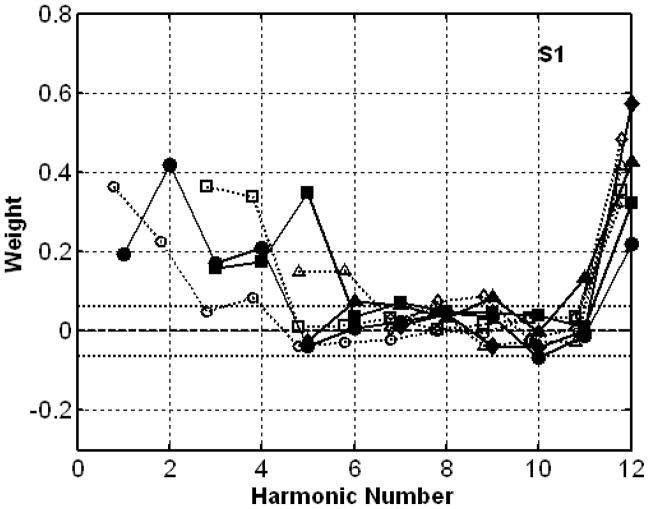
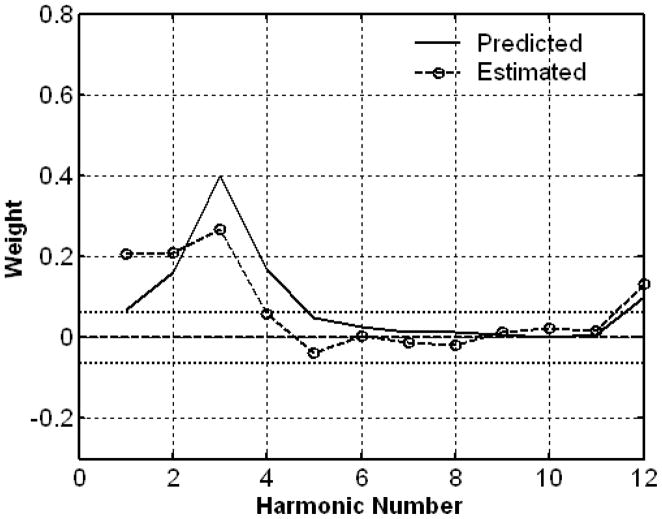
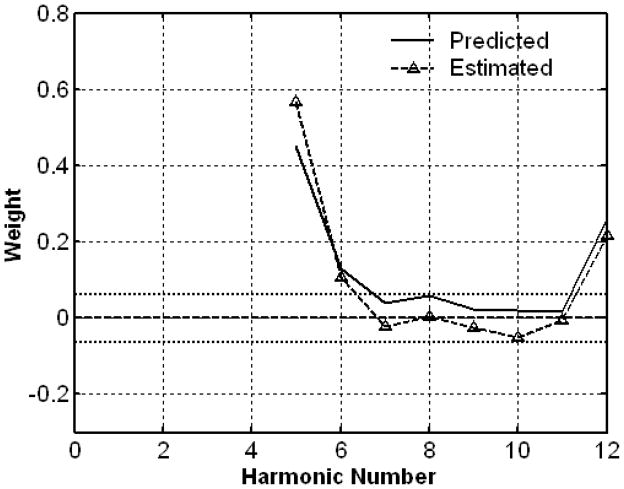
Perceptual weights were estimated in a pitch-comparison experiment to assess the relative influences of individual partial tones on listeners' pitch judgments. The stimuli were harmonic sounds (F0=200 Hz) with partials up to the 12th. Low-numbered partials were removed step-by-step, so that the remaining higher-numbered partials would have a better chance of showing any effect. The individual frequencies of the partials were perturbed randomly on each stimulus presentation, and weights were estimated as the correlation coefficients between the frequency perturbations and the listeners' responses. When the harmonic sounds contained all twelve partials, the listeners depended mostly on the low-numbered, resolved partials within the well-established dominance region. As the low-numbered partials were taken out of the dominance region, the listeners mostly listened to the lowest and highest partials at the spectral edges. For one listener, such an edge-listening strategy took the form of relying on nonlinear combination tones. Overall, there was no indication of any influence on pitch from unresolved partials, thus no evidence of contribution to pitch from temporal cues carried by this group of partials. The estimated patterns of weights were well described by the predictions of Goldstein's optimal-processor model. The predicted weights were inversely proportional to the amount of error for estimating the individual frequencies of the partials. The agreement between the predicted and measured weights suggests that, for harmonic sounds, partials whose frequencies are perceived with the best precision will likely have the greatest influence on perceived pitch.
Copyright © 2010 Elsevier B.V. All rights reserved.
Figures
Similar articles
-
The effect of inharmonic partials on pitch of piano tones.J Acoust Soc Am. 2005 May;117(5):3268-72. doi: 10.1121/1.1882963. J Acoust Soc Am. 2005. PMID: 15957792
-
Harmonic partials facilitate pitch discrimination in humans: electrophysiological and behavioral evidence.Neurosci Lett. 2000 Jan 21;279(1):29-32. doi: 10.1016/s0304-3940(99)00941-6. Neurosci Lett. 2000. PMID: 10670780
-
Perception of noise-vocoded tone complexes: A time domain analysis based on an auditory filterbank model.Hear Res. 2018 Sep;367:1-16. doi: 10.1016/j.heares.2018.07.003. Epub 2018 Jul 4. Hear Res. 2018. PMID: 30005269
-
Does fundamental-frequency discrimination measure virtual pitch discrimination?J Acoust Soc Am. 2010 Oct;128(4):1930-42. doi: 10.1121/1.3478786. J Acoust Soc Am. 2010. PMID: 20968365 Free PMC article.
-
Pitch, harmonicity and concurrent sound segregation: psychoacoustical and neurophysiological findings.Hear Res. 2010 Jul;266(1-2):36-51. doi: 10.1016/j.heares.2009.09.012. Epub 2009 Sep 27. Hear Res. 2010. PMID: 19788920 Free PMC article. Review.
Cited by
-
Pitch discrimination is better for synthetic timbre than natural musical instrument timbres despite familiarity.J Acoust Soc Am. 2022 Jul;152(1):31. doi: 10.1121/10.0011918. J Acoust Soc Am. 2022. PMID: 35931555 Free PMC article.
-
Perception of missing fundamental pitch by 3- and 4-month-old human infants.J Acoust Soc Am. 2012 Dec;132(6):3874-82. doi: 10.1121/1.4763991. J Acoust Soc Am. 2012. PMID: 23231118 Free PMC article.
-
Further evidence that fundamental-frequency difference limens measure pitch discrimination.J Acoust Soc Am. 2012 May;131(5):3989-4001. doi: 10.1121/1.3699253. J Acoust Soc Am. 2012. PMID: 22559372 Free PMC article.
References
-
- Ahumada AJ., Jr Classification image weights and internal noise level estimation. J Vision. 2002;2:121–131. - PubMed
-
- Ahumada AJJ, Lovell J. Stimulus features in signal detection. J Acoust Soc Am. 1971;49:1751–1756.
-
- Berg BG. Analysis of weights in multiple observation tasks. J Acoust Soc Am. 1989;86:1743–1746. - PubMed
-
- Burns EM, Viemeister NF. Nonspectral pitch. J Acoust Soc Am. 1976;60:863–869.
-
- de Boer E. PhD thesis. Amsterdam: 1956. On the ‘Residue’ in Hearing.
Publication types
MeSH terms
Grants and funding
LinkOut - more resources
Full Text Sources
Research Materials
