. 2010 Sep;177(3):1514-33.
doi: 10.2353/ajpath.2010.100328. Epub 2010 Aug 13.

The transcription factor MIST1 is a novel human gastric chief cell marker whose expression is lost in metaplasia, dysplasia, and carcinoma

Affiliations

The transcription factor MIST1 is a novel human gastric chief cell marker whose expression is lost in metaplasia, dysplasia, and carcinoma

Jochen K M Lennerz et al. Am J Pathol. 2010 Sep.

Abstract

The lack of reliable molecular markers for normal differentiated epithelial cells limits understanding of human gastric carcinogenesis. Recognized precursor lesions for gastric adenocarcinoma are intestinal metaplasia and spasmolytic polypeptide expressing metaplasia (SPEM), defined here by ectopic CDX2 and TFF2 expression, respectively. In mice, expression of the bHLH transcription factor MIST1, normally restricted to mature chief cells, is down-regulated as chief cells undergo experimentally induced metaplasia. Here, we show MIST1 expression is also a specific marker of human chief cells. SPEM, with and without MIST1, is present in human lesions and, akin to murine data, likely represents transitional (TFF2(+)/MIST1(+) = "hybrid"-SPEM) and established (TFF2(+)/MIST1(-) = SPEM) stages. Co-visualization of MIST1 and CDX2 shows similar progressive loss of MIST1 with a transitional, CDX2(+)/MIST1(-) hybrid-intestinal metaplasia stage. Interinstitutional analysis and comparison of findings in tissue microarrays, resection specimens, and biopsies (n > 400 samples), comprising the entire spectrum of recognized stages of gastric carcinogenesis, confirm MIST1 expression is restricted to the chief cell compartment in normal oxyntic mucosa, rare in established metaplastic lesions, and lost in intraepithelial neoplasia/dysplasia and carcinoma of various types with the exception of rare chief cell carcinoma ( approximately 1%). Our findings implicate MIST1 as a reliable marker of mature, healthy chief cells, and we provide the first evidence that metaplasia in humans arises at least in part from the chief cell lineage.


Figures

Figure 1
Figure 1
Sequence alignment of class II bHLH transcription factors to design immunogen with minimal cross-reactivity. Alignment is ordered by unweighted clustering according to sequence similarity. Amino acid position corresponding to complete BHLHB8 (MIST1, also known as BHLHA15) sequence is indicated on top. Gaps of alignment are marked by hyphen, amino acids are highlighted in turquoise when more than 50% conserved across proteins, highlighted in green when representing similar amino acids and displayed as green font when weakly similar to consensus sequence (last row); region omitted from MIST1 immunogenic peptide by ribocloning is indicated by pink pounds (labeled BHLB8_#).
Figure 2
Figure 2
New rabbit-anti-human MIST1 antibody is a specific marker for human zymogenic (chief) cells. A: Western blot from HGC cells transfected with eGFP alone (lane 2) and with the MIST1-eGFP construct (lane 3); the latter shows a single band with the expected molecular weight (∼50 kD = MIST1+eGFP) when compared with the size-control (lane 1). B: HGC-27 cells transiently transfected with the MIST1-eGFP construct show nuclear eGFP fluorescence. C: Normal human gastric mucosa with lumen at top. Luminal surface (foveolar or pit) cells are labeled with conjugated lectin DBA (Alexafluor-594, red), parietal cells in the neck-zone with VEGFB (Alexafluor-488, green), and nuclei with Hoechst 33258 (blue). The rabbit anti-human MIST1 antibody (Alexafluor-647, magenta) stains exclusively nuclei at the base of the gastric unit corresponding to chief cells. The inset demonstrates round, basally located MIST1-positive nuclei. Few interspersed parietal cells (VEGFB-positive) lack MIST1 expression. D: Marker distribution along the pit-base axis (MIST1 + H+-K+-ATPase + Hoechst). After orientation, merged channels (top) were separated (eg, middle) and subsequently merged by using a customized pixel algorithm that also allows visualization (bottom). Merged images of at least 45 gastric units were quantified and are plotted as relative fluorescent intensity after normalization to the brightest pixel. Note that parietal cells concentrate in the neck (midportion) of the unit, whereas MIST1+ chief cells cluster at the base. E: Antral-type mucosa shows no epithelial MIST1 expression. Inset shows pyloric-type glandular cells with basal and flat MIST1-negative nuclei; arrow shows MIST1-positive plasma cells that serve as internal positive controls. F: The rabbit-anti-human MIST1 antibody also demonstrates chief-cell specific staining in oxyntic-mucosa of the mouse (Mist1+/+) that is absent in Mist1−/−-animals. Scale bars = 20 μm in B, inset in E; 100 μm in C and E; and 50 μm in F.
Figure 3
Figure 3
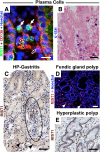
MIST1 in plasma cells, gastritis and gastric polyps. A: Lamina propria shows colocalization of nuclear MIST1-staining (green) and Hoechst (blue), resulting in the merged color turquoise in CD138-positive (syndecan, cytoplasmic, red) plasma cells (arrows). Note that not all CD138-positive cells are MIST1-positive (open arrows). B: Presence of plasma cells confirmed by in situ hybridization of kappa and lambda (not shown) on a subsequent tissue section. C: Helicobacter pylori (HP) gastritis (= chronic active gastritis) with deep glandular injury (region of intraepithelial neutrophils and plasma cells in mesenchyme encircled) demonstrates preserved nuclear MIST1-expression in basal cells (arrowheads). D: Individual MIST1-positive nuclei (arrowheads) in cystically dilated fundic glands. E: Fundic hyperplastic polyp is MIST1 negative. Scale bars = 20 μm in A; 50 μm in B; and 100 μm in CE.
Figure 4
Figure 4
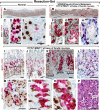
MIST1 in human SPEM. A: Normal oxyntic mucosa shows MIST1 (brown) at base, TFF2 (red) in neck-zone, and hematoxylin background stain (blue) in foveolar epithelium, appearing as well demarcated foveolar-, neck-, and basal zone (oxyntic tricolor). B: In SPEM, oxyntic mucosa shows reversal of the TFF2 (red) staining pattern; the latter is located at the base resulting in a red basal band on low-power magnification. C: Medium-power views show overlap of TFF2+ (red) and MIST1+ (brown) zones in the mid-glandular region (insets D and E). D: Despite spatial aggregation in the basal neck zone, TFF2+ (red) and MIST1+ (brown) cells represent separate populations with very few cells demonstrating colocalization of both markers (∼0.5%; n = 1655 cells; arrowheads). E: The uppermost base shows abrupt loss of cytoplasmic TFF2-positivity (red, asterisk shows trace residual TFF2). Note the MIST1-negative parietal cell (open arrowhead). F: SPEM shows colocalization of CBP1 and TFF2 at the base of oxyntic-type mucosa. Note the lack of CBP1-positivity in parietal cells (open arrowhead). G: SPEM is MIST1-negative (open arrowhead). H: SPEM demonstrates absence of epithelial positivity for CDX2 (brown) and MIST1 (red). In ∼2 of 50 bases, individual cells with slight MIST1-positivity were noted (asterisk); MIST1-positive nucleus in lamina propria (plasma cell) serves as internal control (arrow). Morphologically, SPEM cells show a flocculent cytoplasm and predominantly basally located, flat nuclei (∼60%), whereas basally located round nuclei (∼35%) or centrally located round nuclei (∼5%; open arrowhead) are rarely observed. Note the oval and flat nuclear shape in the MIST1+ cell (asterisk). I: Medium-power magnification shows focal overlap of TFF2 (red) and MIST1 (brown) positivity at the base (inset M). Note TFF2 labeling in MIST1+ chief cells occurs without complete extension of the TFF2 compartment toward the base. J: Multifocal extension of TFF2 (red) into the MIST1-positive basal compartment (insets N and O). K: Unitary variation of MIST1 (brown) and TFF2 (red) presenting as normal pattern (left), SPEM (basal TFF2; middle), and hybrid-lesion (hybrid-SPEM) with multicellular colocalization of TFF2+/MIST1+ (right). Note presence of TFF2 at the base with overlying MIST1+/TFF2 chief cells (asterisk). L: Hybrid-SPEM is CDX2-negative and shows multifocal retention of MIST1 staining (arrowhead) adjacent to MIST1-negative nuclei (open arrowhead). Note flattened MIST1-negative nuclei (asterisk) and round to oval MIST1+ nuclei (red). M: High-power magnification of hybrid lesion (I) shows cytoplasmic TFF2 in MIST1-positive chief-cells. Note MIST1-negative parietal cells (open arrowhead). N: High-power magnification of upper base (J) shows cytoplasmic TFF2 in MIST1-positive cells (observed very focally in one of five cases) wedged in between MIST1-negative parietal cells. O: High-power magnification of base (J) shows MIST1+/TFF2+-coexpressing cells with round to flattened nuclei (asterisk). P: H&E-stained sections of oxyntic-type mucosa show normal chief cells (CC) and normal parietal cells (PC) admixed with glandular epithelial cells that show hybrid metaplasia. H&E features are the flocculent cytoplasm (distinct from CC) and basally located oval to flat nuclei (asterisk). Scale bars = 500 μm in A and B; 50 μm in C, F, G, P, and M; 20 μm in D, E, H, N, and O; and 100 μm in I, J, K, and L.
Figure 5
Figure 5
MIST1 in routine biopsy material. A: Overview, illustrating limited sampling and orientation of typical biopsy specimen. B: Normal oxyntic-type mucosa shows separation of CBP1-positive chief cells (brown) from TFF2-positive neck cells (red) and double-negative parietal- and foveolar cells (pale blue, hematoxylin). C: Mixture of normal (left), SPEM (middle), and hybrid-SPEM lesion (right). The latter shows admixture with basally located TFF2/CBP1+ cells (arrowhead). Note the presence of parietal cells (open arrowhead). D: Band-like basal TFF2 expression (red) in SPEM without evidence of distinct areas of CBP1-positivity. E: Normal oxyntic-type mucosa with separate TFF2 (red) and MIST1 (brown) compartments in neck and base, respectively. Note MIST1/TFF2 parietal cells (open arrowheads). F and G: Two examples of hybrid-SPEM with different census of MIST1+/TFF2+ chief-cells (F<G); cytoplasmic TFF2+ (red) is localized in cells with nuclear MIST1 (brown; arrowheads). Note MIST1/TFF2 parietal cells (open arrowheads). H: SPEM shows band-like basal TFF2-positivity (red). Note the absence of isolated MIST1+/TFF2 cells on the right (open arrowhead) and the mostly flat, basal nuclei (inset, asterisk). Scale bars = 1 mm in A; 50 μm in BH.
Figure 6
Figure 6
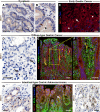
MIST1 in human IM. A: Low-power magnification of oxyntic-type mucosa replaced by goblet cell-rich intestinal metaplastic mucosa in a sample from a patient also given a diagnosis of chronic atrophic gastritis (inset B); MIST1 (brown). B: High-power magnification of intestinalized glands with goblet cells and absence of epithelial nuclear MIST1 positivity; MIST1+ plasma cells serve as internal control (arrow). Note the elongation of MIST1-negative nuclei (open arrowheads). C: CDX2-positive goblet cells (brown) are MIST1 (red) negative (open arrowhead). MIST1+ plasma cells serve as internal control (arrowhead). D: Low-power magnification shows unitary variation of CDX2 (brown) in normal (left), hybrid-SPEM (middle, Figure 4L), and IM (right); insets F, G, and H. Note presence of at least focal MIST1 (red) at base of all units. E: Low-power magnification of subsequent section to D showing unitary variation of CBP1 (brown) in normal (left; IM not present on subsequent levels), hybrid-SPEM (middle), and IM (right). TFF2 (red) is absent in IM and the extent of TFF2 in hybrid-SPEM precludes definitive assessment of CBP1 (compare with region in D; Figure 4L). F: IM shows vertically oriented, elongated, CDX2+ nuclei, involving left half of the gastric gland, whereas right half shows predominantly oval to round MIST1+ nuclei (inset G). G: High-power magnification shows presence of MIST1+/CDX2+ coexpressing nuclei (arrowhead). H: High-power magnification of basal aspects of otherwise completely intestinalized units (D, CDX2-positive) demonstrating interspersed MIST1-expressing chief cells (red). I: Medium-power magnification of normal chief-cells (MIST1+, red) with overlying IM (CDX2+, brown); inset J. J: MIST1+ chief cells with round basally located nuclei are interspersed with CDX2+ intestinal-type cells with elongated, vertically oriented nuclei. Note individual MIST1+/CDX2+ nuclei (arrowhead). Scale bars = 100 μm in A, D, and E; 20 μm in B, G, and J; and 50 μm in C, F, and H.
Figure 7
Figure 7
MIST1 in epithelial neoplasia. A: Medium-power magnification of low-grade intraepithelial neoplasia (dysplasia) demonstrates almost exclusively MIST1 nuclei open arrowhead; inset B. B: High-power magnification of low-grade dysplasia (A) shows focal preserved MIST1-expression (brown; arrowhead); representing one of seven dysplastic lesions scored as MIST1-positive (Table 2). C: Medium-power magnification of so-called early-gastric carcinoma with focally retained epithelial MIST1-expression (arrowheads); MIST1+ plasma cells serve as internal control (arrow). D: Diffuse-type gastric adenocarcinomas are MIST1-negative; MIST1+ plasma cells serve as internal control (arrows). E: Low-power magnification of diffuse-type gastric adenocarcinoma shows infiltration of MUC6+/MIST1 tumor cells within the lamina propria (inset F). F: High-power magnification of MUC6+/MIST1 tumor cells between preserved gastric units (scattered red cells are erythrocytes; note lack of nuclear stain). G: Example of moderately-differentiated intestinal type gastric adenocarcinoma without MIST1 expression. MIST1+ plasma cells serve as internal control (arrow). Note tumor cells show faint cytoplasmic staining (asterisk). H: MUC6+/MIST1 intestinal-type adenocarcinoma. I: Three adenocarcinomas showed multifocal MIST1-positivity, and had features consistent with chief-cell differentiation (so-called “chief-cell carcinomas”). Scale bars = 100 μm in A, E, and H; 20 μm in B; and 50 μm in C, D, F, and G.
Figure 8
Figure 8
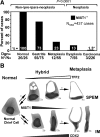
Summary of MIST1 as a marker for healthy chief-cells (A) and key features of hybrid metaplasia in SPEM and IM (B). A: Summary of MIST1 staining in the different diagnostic groups (Dgn) shows the proportion of staining (N+) expressed in percentage of the total number of cases per group (N). Asterisk denotes the three MIST1-positive carcinomas (= 1.3%) are considered chief-cell carcinomas (see Figure 7I). Cases here include 421 resection/TMA cases (Table 2) plus 34 cases in the biopsy set, but exclude 14 antral samples and four hyperplastic polyps. B: Cytological and immunophenotypic features of normal chief cells (1), hybrid metaplasia (2,3), SPEM (4a), and IM (4b, 5b) displayed as presumed morphological sequence but not necessarily linear progression (double arrows a, b indicate that hybrid lesions could also regress to normal). In all cells, nuclei are nondysplastic and basal nuclear position (polarity) is maintained, whereas apical differentiation and immunophenotype differs. Note elongated nuclei in SPEM are oriented parallel to the basement membrane (4a), whereas IM demonstrates vertical nuclei [displayed as a goblet cell (4b) and an absorptive enterocyte (5b; apical differentiation = brush border)].

References

    1. Parkin DM, Bray F, Ferlay J, Pisani P. Global cancer statistics, 2002. CA Cancer J Clin. 2005;55:74–108. - PubMed
    1. Jarvi O, Lauren P. On the role of heterotopias of the intestinal epithelium in the pathogenesis of gastric cancer. Acta Pathol Microbiol Scand. 1951;29:26–44. - PubMed
    1. Correa P. Human gastric carcinogenesis: a multistep and multifactorial process; First American Cancer Society Award Lecture on Cancer Epidemiology and Prevention. Cancer Res. 1992;52:6735–6740. - PubMed
    1. Marshall BJ, Warren JR. Unidentified curved bacilli in the stomach of patients with gastritis and peptic ulceration. Lancet. 1984;1:1311–1315. - PubMed
    1. Goldenring JR, Nam KT, Wang TC, Mills JC, Wright NA. Spasmolytic polypeptide-expressing metaplasia and intestinal metaplasia: time for reevaluation of metaplasias and the origins of gastric cancer. Gastroenterology. 2010;138:2207–2210. - PMC - PubMed

Publication types

MeSH terms