. 2010 Sep 15;185(6):3149-57.
doi: 10.4049/jimmunol.1000810. Epub 2010 Aug 13.

APCs expressing high levels of programmed death ligand 2 sustain the development of CD4 T cell memory

Affiliations

APCs expressing high levels of programmed death ligand 2 sustain the development of CD4 T cell memory

Jason S Ellis et al. J Immunol. .

Abstract

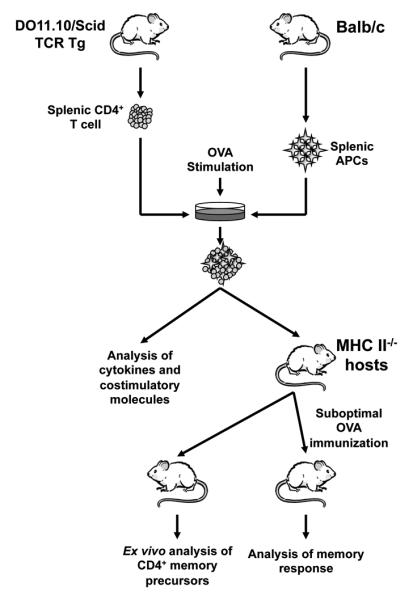
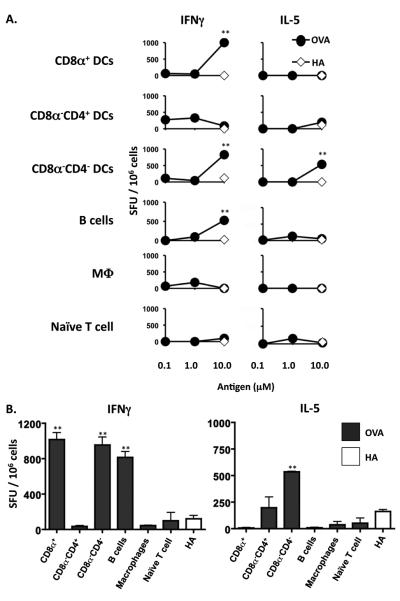
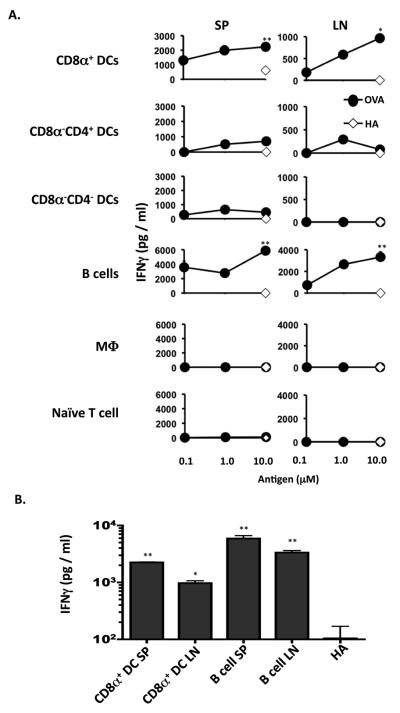
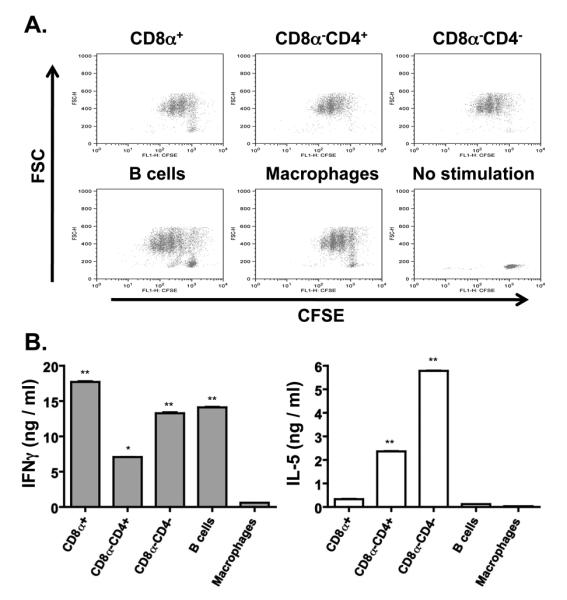
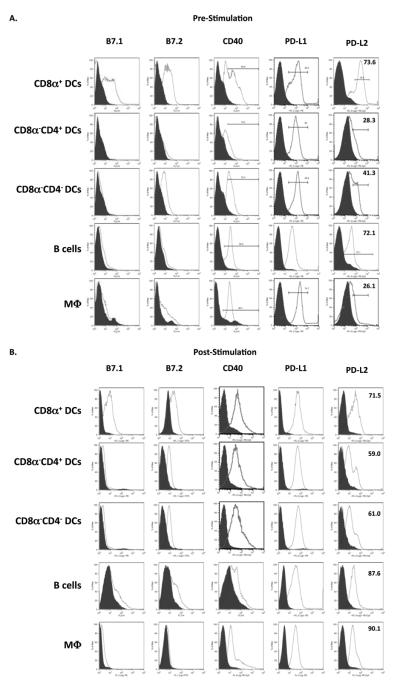
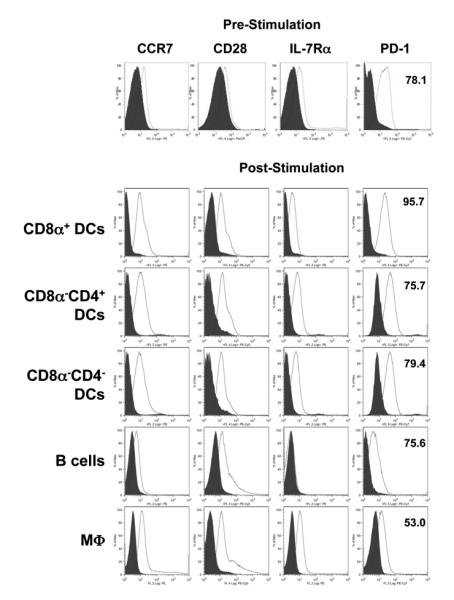
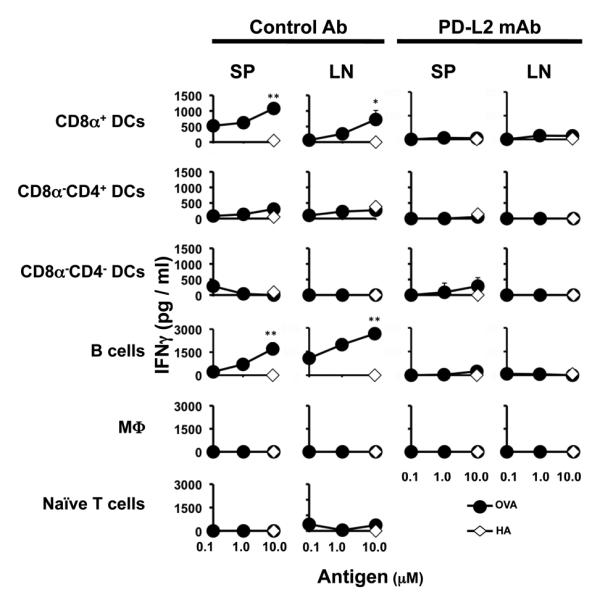
The role APCs play in the transition of T cells from effector to memory remains largely undefined. This is likely due to the low frequency at which long-lived T cells arise, which hinders analysis of the events involved in memory development. In this study, we used TCR transgenic T cells to increase the frequency of long-lived T cells and developed a transfer model suitable for defining the contribution of APCs to the development of CD4 T cell memory. Accordingly, naive TCR transgenic T cells were stimulated in vitro with Ag presented by different types of APCs and transferred into MHC class II-deficient mice for parking, and the hosts were later analyzed for long-lived T cell frequency or challenged with suboptimal dose of Ag, and the long-lived cells-driven memory responses were measured. The findings indicate that B cells and CD8alpha(+) dendritic cells sustained elevated frequencies of long-lived T cells that yielded rapid and robust memory responses upon rechallenge with suboptimal dose of Ag. Furthermore, both types of APCs had significant programmed death (PD) ligand 2 expression prior to Ag stimulation, which was maintained at a high level during presentation of Ag to T cells. Blockade of PD ligand 2 interaction with its receptor PD-1 nullified the development of memory responses. These previously unrecognized findings suggest that targeting specific APCs for Ag presentation during vaccination could prove effective against microbial infections.


Figures

Figure 1
Figure 1. Schematic representation of the animal model used to investigate development of CD4+ T cell memory
Splenic CD4+ T cells from adult DO11.10/Scid mice are plated with irradiated (3000 × rads) purified Balb/c APCs and stimulated with OVA peptide. The T cells are then used for expression of costimulatory molecules, cytokine production, or adoptive transfer into MHC II−/− Balb/c mice. For the latter, after 4 months parking, the hosts are either used to analyze the frequency of memory T cell precursors prior to any re-challenge with OVA peptide or given Balb/c DC and immunized with a suboptimal dose of OVA peptide in CFA and used to evaluate IFNγ memory responses.
Figure 2
Figure 2. CD8α+ and CD8αCD4 DCs, and B cells induce the generation of memory precursors
MHC II−/− Balb/c mice recipient of DO11.10 CD4+ T cells stimulated in vitro with 0.5 μM (for B cells and M03D5) or 1.0 μM (for DC subsets), OVA peptide presented by specific APC were sacrificed 4 months after transfer. The splenic cells (1 × 10⁶ per well) were then stimulated with graded amounts of OVA peptide presented on MHC II+/+ Balb/c splenic APCs (0.2 × 10⁶ per well) and (A) the frequency of IFNγ and IL-5 producing cells was determined by ELISPOT and expressed as spot forming units (SFU) per 106 cells. (B), bar graph representing the frequency of cytokine producing cells obtained with 10 μM OVA peptide stimulation. ** p<0.01. p values represent comparison of IFNγ production in 10μM OVA peptide groups to that in 10μM HA peptide. Data representative of 3 independent experiments with 3 mice per group.
Figure 3
Figure 3. CD8α+ DC and B cells support the development of IFNγ–producing memory T cells
MHC II−/− Balb/c mice recipient of DO11.10 CD4+ T cells stimulated in vitro with OVA peptide presented by specific APC were given, 4 months after T cell transfer, MHC II+/+ Balb/c DC and challenged with a suboptimal dose of OVA peptide (20 μg/mouse) in CFA (1vol /1 vol). Five days later the mice were sacrificed and the SP (9 × 10⁵ per well) and LN (3 × 10⁵ per well) were stimulated with OVA or control HA peptide presented on MHC II+/+ Balb/c APC splenocytes (2 × 10⁵ per well). (A), IFNγ responses obtained by ELISA upon stimulation with graded concentrations of OVA peptide or 10μM HA peptide. (B) Amount of IFNγ obtained with 10μM OVA peptide stimulation for mice recipient of T cells that initially encountered Ag presented by CD8α+ DCs or B cells. *p<0.05, **p<0.01. p values represent comparison of IFNγ production in 10μM OVA peptide groups to that in 10μM HA peptide. Data representative of three independent experiments with three mice per group.
Figure 4
Figure 4. CD8α+ DC- and B cell-stimulated DO11.10 CD4+ T cells produce IFNγ but not IL-5
CFSE-labeled DO11.10 CD4+ T cells (2 × 10⁶ cells/well) were stimulated with OVA peptide (1.0 μM DC subsets, 0.5 μM B cells and M03D5) presented by CD8α+ DCs (0.4 × 10⁶ cells/well), CD8αCD4+ DCs (0.4 × 10⁶ cells/well), CD8αCD4 DCs (0.4 × 10⁶ cells/well), M03D5 (0.3 × 10⁶ cells/well), or B cells (2.0 × 10⁶ cells/well). (A) shows CFSE dilution by the T cells upon presentation of OVA peptide by the indicated APCs. CFSE-labeled unstimulated T cells (No stimulation) are included as control. (B) shows IFNγ and IL-5 production as measured by ELISA for each of the indicated stimulation cultures. * p<0.05, ** p<0.01. Data representative of four independent experiments.
Figure 5
Figure 5. Pattern of costimulatory molecules expressed on APCs prior to and post culture with DO11.10 T cells
A. Freshly purified CD8α+ DCs, CD8αCD4+ DCs, CD8αCD4 DCs, M03D5, or B cells were stained with fluorescently labeled antibodies specific for B7.1, B7.2, CD40, PD-L1, and PD-L2 as described in Materials and Methods and analyzed by flow cytometry. B. Purified CD8α+ DCs (0.4 × 10⁶ cells/well), CD8αCD4+ DCs (0.4 × 10⁶ cells/well), CD8αCD4 DCs (0.4 × 10⁶ cells/well), M03D5 (0.3 × 10⁶ cells/well), or B cells (2.0 × 10⁶ cells/well) were incubated with CD4+ DO11.10 T cells (2.0 × 10⁶ cells/well) and OVA peptide. The cells were then stained with fluorescently labeled antibodies specific for B7.1, B7.2, CD40, PD-L1, and PD-L2. The numbers indicate percent of marker positive cells relative to isotype control (filled) among cells gated on either CD11c (DCs), CD11b (M03D5) or B220 (B cells). Data representative of three independent experiments.
Figure 6
Figure 6. Pattern of costimulatory molecules expression on DO11.10 T cells before and after stimulation with antigen
DO11.10 CD4+ T cells (2.0 × 10⁶ cells/well) were stained with antibodies specific for CCR7, CD28, IL-7Rα, and PD-1 before and after stimulation with OVA peptide presented on CD8α+ DCs (1.0 μM OVA, 0.4 × 10⁶ cells/well), CD8αCD4+ DCs (1.0 μM OVA, 0.4 × 10⁶ cells/well), CD8αCD4 DCs (1.0 μM OVA, 0.4 × 10⁶ cells/well), M03D5 (0.5 μM OVA, 0.3 × 10⁶cells/ well), or B cells (0.5 μM OVA, 2.0 × 10⁶ cells/well) as described in Material and Methods. The histograms show staining of the cells gated on KJ1-26 versus isotype control (filled). The numbers indicate the percent of positive cells for the indicated markers. Data representative of three independent experiments.
Figure 7
Figure 7. Blockade of PD-1/PD-L2 interaction interferes with induction of T cell memory by CD8α+ DC and B cells
DO11.10 CD4+ T cells (2.0 × 10⁶ cells/well) were stimulated with OVA peptide presented on CD8α+ DCs (1.0 μM OVA, 0.4 × 10⁶ cells/well), CD8αCD4+ DCs (1.0 μM OVA, 0.4 × 10⁶ cells/well), CD8αCD4 DCs (1.0 μM OVA, 0.4 × 10⁶ cells/well), M03D5 (0.5 μM OVA, 0.3 × 10⁶cells/ well), or B cells (0.5 μM OVA, 2.0 × 10⁶ cells/well) in the presence of 5μg/ml anti-PD-L2 antibody or rat IgG isotype control. After extensive washing the T cells were adoptively transferred into MHC II−/− host mice. Four months after transfer, the mice were given MHC II+/+ Balb/c DC and challenged with a suboptimal dose of OVA peptide (20 μg/mouse) in CFA (1 vol. / 1 vol.). Five days later the mice were sacrificed and the SP (9 × 10⁵ per well) and LN (3 × 10⁵ per well) cells were stimulated with OVA or control HA peptide presented on MHC II+/+ Balb/c APC splenocytes (2 × 10⁵ per well). IFNγ responses obtained upon stimulation with graded concentrations of OVA peptide or 10μM HA peptide were measured by ELISA. MHC II−/− Balb/c mice recipient of unstimulated DO11.10 CD4+ T cells (Naïve T cells) are included as control. *p<0.05, **p<0.01. Data representative of three independent experiments with 3-4 mice per group.

References

    1. Doherty PC, Topham DJ, Tripp RA. Establishment and persistence of virus-specific CD4+ and CD8+ T cell memory. Immunol Rev. 1996;150:23–44. - PubMed
    1. Kaech SM, Wherry EJ, Ahmed R. Effector T-cell differentiation: implications for vaccine development. Nat Rev Immunol. 2002;2:251–262. - PubMed
    1. Sallusto F, Geginat J, Lanzavecchia A. Central memory and effector memory T cell subsets: function, generation, and maintenance. Annu Rev Immunol. 2004;22:745–763. - PubMed
    1. Schluns KS, Lefrancois L. Cytokine control of memory T-cell development and survival. Nat Rev Immunol. 2003;3:269–279. - PubMed
    1. Van Parijs L, Abbas AK. Homeostasis and self-tolerance in the immune system: turning lymphocytes off. Science. 1998;280:243–248. - PubMed

Publication types

MeSH terms