. 2010 Oct 22;285(43):33485-33498.
doi: 10.1074/jbc.M110.129353. Epub 2010 Aug 14.

Novel changes in NF-{kappa}B activity during progression and regression phases of hyperplasia: role of MEK, ERK, and p38

Affiliations

Novel changes in NF-{kappa}B activity during progression and regression phases of hyperplasia: role of MEK, ERK, and p38

Parthasarathy Chandrakesan et al. J Biol Chem. .

Abstract

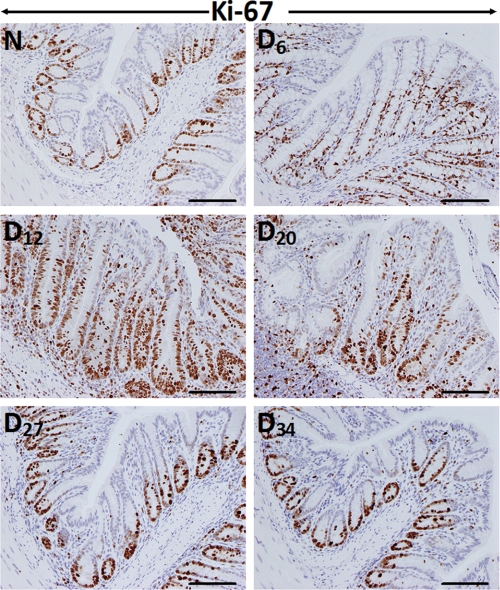
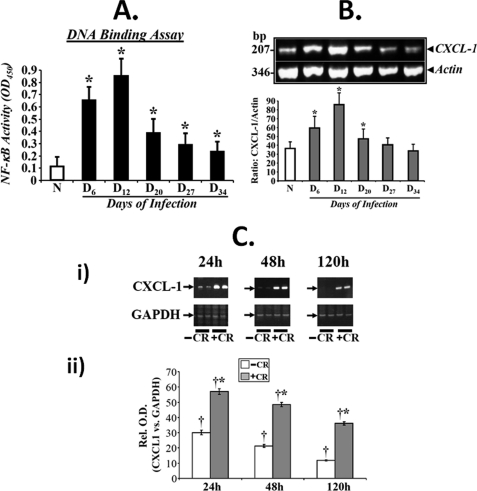
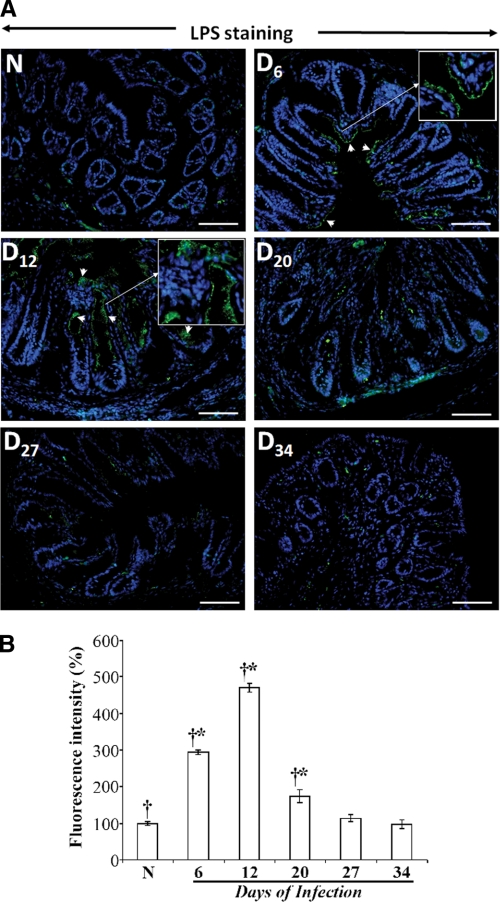
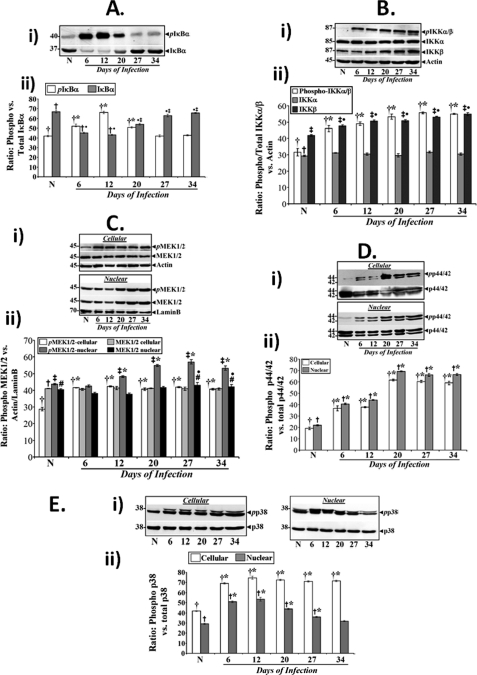
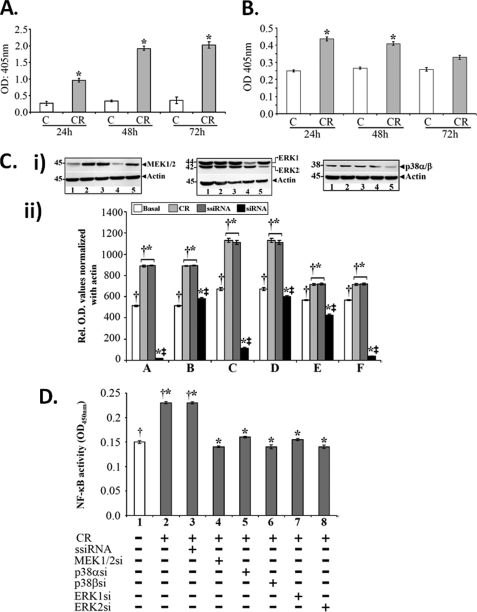
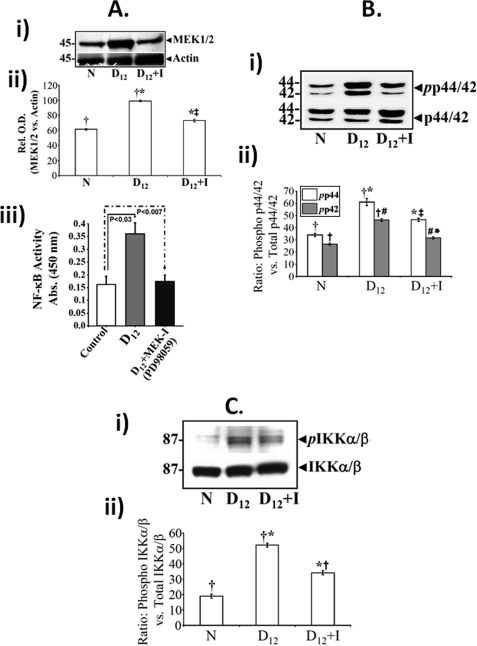
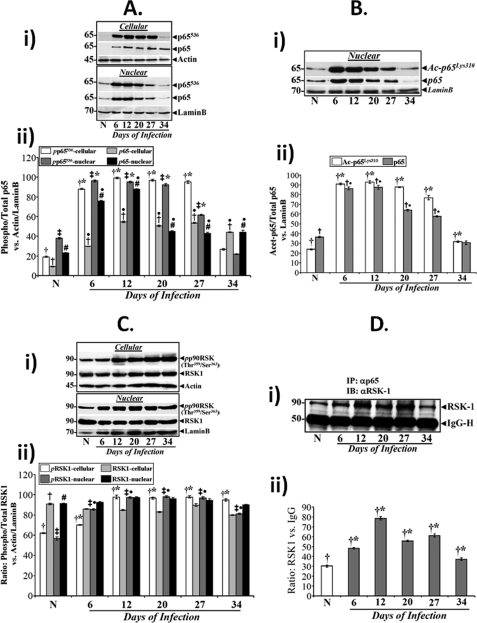
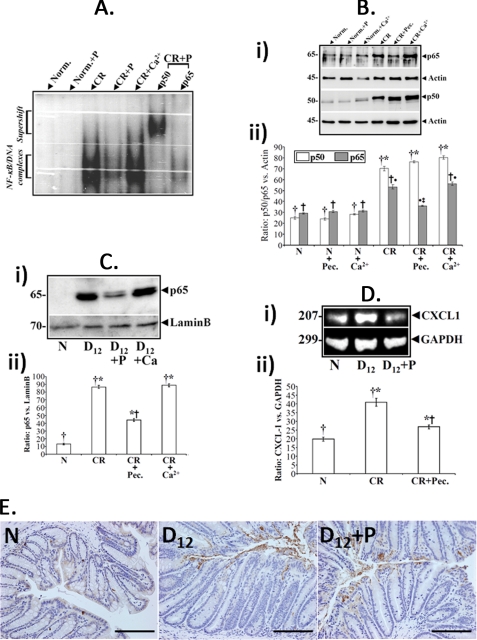
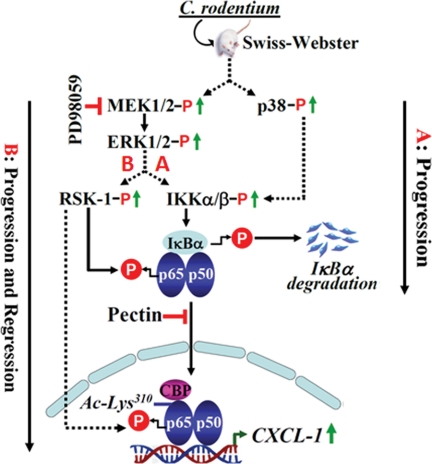
Utilizing the Citrobacter rodentium-induced transmissible murine colonic hyperplasia (TMCH) model, we measured hyperplasia and NF-κB activation during progression (days 6 and 12 post-infection) and regression (days 20-34 post-infection) phases of TMCH. NF-κB activity increased at progression in conjunction with bacterial attachment and translocation to the colonic crypts and decreased 40% by day 20. NF-κB activity at days 27 and 34, however, remained 2-3-fold higher than uninfected control. Expression of the downstream target gene CXCL-1/KC in the crypts correlated with NF-κB activation kinetics. Phosphorylation of cellular IκBα kinase (IKK)α/β (Ser(176/180)) was elevated during progression and regression of TMCH. Phosphorylation (Ser(32/36)) and degradation of IκBα, however, contributed to NF-κB activation only from days 6 to 20 but not at later time points. Phosphorylation of MEK1/2 (Ser(217/221)), ERK1/2 (Thr(202)/Tyr(204)), and p38 (Thr(180)/Tyr(182)) paralleled IKKα/β kinetics at days 6 and 12 without declining with regressing hyperplasia. siRNAs to MEK, ERK, and p38 significantly blocked NF-κB activity in vitro, whereas MEK1/2-inhibitor (PD98059) also blocked increases in MEK1/2, ERK1/2, and IKKα/β thereby inhibiting NF-κB activity in vivo. Cellular and nuclear levels of Ser(536)-phosphorylated (p65(536)) and Lys(310)-acetylated p65 subunit accompanied functional NF-κB activation during TMCH. RSK-1 phosphorylation at Thr(359)/Ser(363) in cellular/nuclear extracts and co-immunoprecipitation with cellular p65-NF-κB overlapped with p65(536) kinetics. Dietary pectin (6%) blocked NF-κB activity by blocking increases in p65 abundance and nuclear translocation thereby down-regulating CXCL-1/KC expression in the crypts. Thus, NF-κB activation persisted despite the lack of bacterial attachment to colonic mucosa beyond peak hyperplasia. The MEK/ERK/p38 pathway therefore seems to modulate sustained activation of NF-κB in colonic crypts in response to C. rodentium infection.


Figures

FIGURE 1.
FIGURE 1.
Crypt hyperplasia as measured by Ki-67 staining. Immunohistochemical labeling of Ki-67 as a marker of proliferation in paraffin-embedded sections was prepared from the distal colons of uninfected normal (N) and C. rodentium-infected (days 6–34) mice. D, day. Bar, 75 μm (n = 5).
FIGURE 2.
FIGURE 2.
A, NF-κB activity measured via DNA binding assay. Crypt nuclear extracts were prepared from normal (N) and days (D) 6–34 post-infected mice, and the presence of activated NF-κB p65 in the nuclear extracts was examined by utilizing Trans AM NF-κB p65 Chemi Transcription Factor Assay kit from Active Motif. Significant increases in NF-κB activity was recorded at days 6 and 12 with sustained activation at days 20, 27, and 34 of TMCH (n = 3; p < 0.05). B, expression of downstream target for NF-κB, CXCL-1/KC, during TMCH. Total RNA was extracted from colonic crypts isolated from normal or days 6–34 post-infected mice. CXCL-1/KC expression was measured via semi-quantitative RT-PCR using actin mRNA as loading control (upper panel). Lower panel represents a bar graph showing relative levels of CXCL-1/KC normalized to actin (p < 0.05, n = 3). C, measurement of CXCL-1/KC expression in YAMC cells in vitro. YAMC cells (5 × 10⁵) were either treated with (+C. rodentium) or without (−C. rodentium) C. rodentium was 90:1 m.o.i. for 3 h. Cells were washed thoroughly to remove bacteria and incubated in fresh medium containing antibiotics for indicated periods. Total RNA was examined for the expression of CXCL-1/KC via RT-PCR, and GAPDH was used as loading control. A significant increase in the level of CXCL-1 was observed at 24 and 48 h post-infection with sustained expression even at 120 h compared with uninfected control (C, panel i; n = 3). C, panel ii, representative bar graph showing the relative expression levels of CXCL-1 normalized to GAPDH. *, p < 0.05 versus control (†, n = 3).
FIGURE 3.
FIGURE 3.
A, immunofluorescence detection of LPS as a surrogate for Citrobacter presence in the distal colon isolated from uninfected normal (N) and days (D) 6–34 (D6D34) post-infected mice. Paraffin-embedded sections were deparaffinized, subjected to antigen retrieval, and incubated overnight at 4 °C with anti-LPS antibody. Following incubation with secondary antibody conjugated with fluorescein isothiocyanate (FITC), slides were analyzed by fluorescent microscopy using Axiophot 2 microscope (Carl Zeiss, Germany). Arrows indicate bacterial binding to the colonic mucosa in the sections. Insets represent enlarged images to show specific bacterial attachment to the colonic mucosa at days 6 and 12 post-C. rodentium infection. B, representative bar graph showing percent change in the fluorescence intensity at indicated time points. *, p < 0.05 versus control (†, n = 3).
FIGURE 4.
FIGURE 4.
Both canonical and atypical pathways contribute toward NF-κB activation in colonic crypts in vivo. A, panel i, relative levels of phosphorylated and total IκBα in the colonic crypt cellular extracts prepared from uninfected normal (N) and days 6–34 post-infected mice. A, panel ii, representative bar graph showing the ratio of IκBα phosphorylated at Ser32/36 versus total IκBα. *, p < 0.05 versus control (†); ●, p < 0.05 versus control (†); ‡, p < 0.05 versus day 12 (†●, n = 3). B, panel i, both IKKα and -β undergo increased phosphorylation in vivo. Western blot analysis of total crypt extracts prepared from the distal colon of normal and days 6–34 post-infected mice revealed significant and sustained increases in phosphorylation of both IKKα and -β, compared with control (upper panel) although the levels of unphosphorylated IKKs did not change during TMCH (lower panels). B, panel ii, representative bar graph showing relative levels of phosphorylated and total IKKα/β versus actin. *, p < 0.05 versus control (†, n = 3); ●, p < 0.05 versus control (‡, n = 3). C–E, changes in the relative levels of MEK1/2, p44/42-ERK, and p38 during TMCH. Crypt cellular extracts prepared from the distal colons of normal and days 6–34 post-infected mice were analyzed for the relative abundance of MEK1/2 (C, panel i), p44/42-ERK (D, panel i), and p38 (E, panel i) proteins by Western blot analysis. Relative levels of phospho-MEK1/2 (pMEK1/2), p44/42 ERK (pp44/42), and p38 (pp38) exhibited dramatic increases in both cellular and nuclear extracts at peak hyperplasia, and the levels remained elevated during regression phase (days 20–34) of hyperplasia. Bar graphs in C, panel ii (*, p < 0.05 versus control (†), ‡*, p < 0.05 versus control (‡); ●, p < 0.05 versus control (#; n = 3)); D, panel ii (*, p < 0.05 versus control (†, n = 3); †*, p < 0.05 versus control (†, n = 3)); and E, panel ii (*, p < 0.05 versus control (†, n = 3); †*, p < 0.05 versus control (†, n = 3)) represent relative abundance of phosphorylated cellular/nuclear proteins normalized to actin/lamin B.
FIGURE 5.
FIGURE 5.
Signaling via TLR4 and MEK/ERK/p38 regulates NF-κB activity in response to C. rodentium infection. A and B, functional analysis of TLR4. TLR4/NF-kB/SEAPorter HEK293 cells were infected with C. rodentium (CR) for 3 h, washed to remove bacteria, and SEAP levels were measured in the spent medium (A) and cell extracts (B) via SEAP assay kit. Significant and sequential increases in SEAP levels indicating NF-κB activation were recorded at 24, 48, and 72 h in the spent medium with concomitant decreases in the cell extracts at these time points (*, p < 0.05 versus uninfected control; n = 3). C, control. C, effect of siRNAs on MEK, ERK, and p38 levels in vitro. YAMC cells in culture were transiently transfected either with scrambled siRNA (ssiRNA) or siRNAs specific to MEK1/2, ERK1/2, and p38α/β. The transfected cells were treated with or without C. rodentium for 3 h, washed to remove bacteria, and processed for Western blotting after 48 h. Samples in various lanes are as follows: 1, basal; 2, C. rodentium; 3, C. rodentium + scrambled siRNA; 4, C. rodentium + siRNA (MEK1, ERK1, and p38α); 5, C. rodentium + siRNA (MEK2, ERK2, and p38β). Please note that siRNAs to MEK1, ERK1/2, and p38β, in particular, caused significant reduction in the levels of these proteins (C, panel i). C, panel ii, representative bar graph showing relative levels of MEK1/2 (A and B), ERK1/2 (C and D), and p38α/β (E and F) normalized to actin. *, p < 0.03 versus control (†, n = 3); ‡, p < 0.05 versus C. rodentium/scrambled siRNA (†*; n = 3). D, effect of blocking MEK/ERK/p38 on NF-κB activity. DNA binding assay was performed in YAMC cells transfected either with scrambled siRNA (ssiRNA) or siRNA specific for each kinase and infected with or without C. rodentium as described above. Various lane assignments are as follows: 1, basal; 2, C. rodentium-infected; 3, C. rodentium + scrambled siRNA; 4–8; C. rodentium + siRNAs for MEK1 (4), p38α (5), p38β (6), ERK1 (7), and ERK2 (8), respectively. *, p < 0.05 versus control (†, n = 3).
FIGURE 6.
FIGURE 6.
A, effect of MEK1/2 inhibition on NF-κB activity in vivo. Swiss-Webster mice were divided into two groups and injected once a day for 10 days with either control or specific MEK1/2 inhibitor, PD98059 (see “Experimental Procedures”). 2 h after the last injection, colonic crypts were isolated and fractionated into cytosolic and nuclear extracts. Representative Western blots for total MEK1/2 in the colonic crypt cellular extracts prepared from uninfected normal (N), day 12 (D12), and day 12 +,inhibitor (D12+I)-treated mice (A, panel i). A, panel ii, representative bar graph showing relative levels of MEK1/2 when normalized to actin. *, p < 0.05 versus control (†, n = 3); ‡, p < 0.05 versus day 12 (†*, n = 3). A, panel iii, DNA binding assay. PD98059 significantly inhibited NF-κB activation, measured in a DNA binding assay with nuclear extracts prepared from day 12 + inhibitor (D12+I)-treated mice, compared with levels measured in either control or day 12 (D12) mice alone. Each bar represents mean ± S.E. values from three measurements from three separate mice. p values (<0.03 for day 12 and <0.007 for day 12 + inhibitor), respectively, versus corresponding control values. B, panel i, and C, panel i, representative Western blots showing relative levels of phospho (pp44/42) and total p44/42-ERK (B) and phospho (pIKKα/β) and total IKKα/β (C) in the colonic crypt cellular extracts prepared from uninfected normal (N), day 12 (D12), and day 12 + inhibitor (D12+I)-treated mice. Bar graphs in B, panel ii, and C, panel ii, represent relative levels of phosphorylated and total p44/42 ERK (B, panel ii; *, p < 0.05 versus control (†; n = 3); *‡, p < 0.05 versus day 12 (†*, n = 3); †#, p < 0.05 versus control (†; n = 3); #*, p < 0.05 versus day 12 (†#; n = 3)) and phosphorylated and total IKKα/β (C, panel ii; *, p < 0.05 versus control (†, n = 3); *†, p < 0.05 versus day 12 (†*, n = 3)) normalized to total proteins.
FIGURE 7.
FIGURE 7.
Phosphorylation and acetylation of p65 subunit underlies functional activation of NF-κB during TMCH. Relative levels of phosphorylated (p65536) and total p65 subunit in the cellular and nuclear (A, panel i) extracts prepared from uninfected normal (N) and days 6–34 post-infected mice were determined by Western blotting. A, panel ii, representative bar graph showing relative levels of phosphorylated and total p65 subunit in the cellular and nuclear extracts when normalized to actin/lamin B. Bars, *, p < 0.05 versus control (†, n = 3); ●, p < 0.05 versus control (†, n = 3); ‡*, p < 0.05 versus control (‡, n = 3); ●#, p < 0.05 versus control (#, n = 3). B, nuclear accumulation of acetylated p65 subunit overlaps p65536 kinetics. Relative levels of p65 subunit acetylated at lysine 310 (Ac-p65Lys310) along with total p65 were measured in the nuclear extracts prepared from the distal colons of normal and days 6–34 post-infected mice (B, panel i). B, panel ii, representative bar graph showing relative levels of acetylated/total p65 versus lamin B. *, p < 0.05 versus control (†, n = 3); ●, p < 0.05 versus control (†, n = 3). C, phosphorylation status of RSK-1 during TMCH. C, panel I, relative levels of RSK-1 phosphorylated at Thr359/Ser363 (pp90RSK) and total RSK-1 were measured in the cellular and nuclear extracts prepared from normal and days 6–34 post-infected mice by Western blotting. C, panel ii, representative bar graph showing relative levels of phosphorylated and total p65 subunit in the cellular and nuclear extracts when normalized to actin/lamin B. Bars, *, p < 0.05 versus control (†, n = 3); ‡●, p < 0.05 versus control (‡, n = 3). D, panel I, co-immunoprecipitation: Crypt cellular extracts prepared from the distal colons of normal and days 6–34 post-infected mice were co-immunoprecipitated with anti-p65 and blotted with antibody to RSK-1. Lower panel represents IgG heavy chain. D, panel ii, representative bar graph showing relative levels of normalized RSK-1. *, p < 0.05 versus control (†, n = 3).
FIGURE 8.
FIGURE 8.
Pectin inhibits NF-κB activity in vivo. A, effect of dietary intervention on NF-κB activity in vivo. NF-κB activity in the nuclear extracts were measured via EMSA in uninfected normal (N) or TMCH crypts (D12) isolated from mice receiving either regular chow or high pectin and high calcium diets, respectively. EMSA showing relative levels of activated NF-κB in colonic crypts from mice treated as indicated: Norm., noninfected (N); P, pectin; CR, C. rodentium-infected (D12). Last 2 lanes, p50 but not the p65 subunit, supershifted with the indicated NF-κB subunit antibodies in the C. rodentium + pectin (CR+P)-treated crypt nuclear extracts. Pectin in the absence of TMCH, had no effect on NF-κB. B, effect of dietary intervention on subunit expression. Crypt cellular extracts prepared from mice treated as indicated in legends to A were subjected to Western blotting with antibodies to p50 and p65 subunits, respectively. B, panel ii, representative bar graph showing relative levels of p50/p65 when normalized to actin. Bars, *, p < 0.05 versus control (†, n = 3); †●, p < 0.05 versus control (†, n = 3); ●‡, p < 0.05 versus C. rodentium (†●, n = 3). C and D, effect of dietary intervention on nuclear translocation of NF-κB subunits and expression of downstream target CXCL-1. Crypt nuclear extracts prepared as described in legend to A were subjected to Western blot analysis with antibody to p65 subunit. 6% pectin but not high calcium diet blocked p65 nuclear translocation (C, *, p < 0.05 versus control (†, n = 3); *†, p < 0.05 versus C. rodentium (†*, n = 3)). This led to significant inhibition of NF-κB activity (see A) and subsequent down-regulation of downstream target gene CXCL-1 (D, *, p < 0.05 versus control (†, n = 3); *†, p < 0.05 versus C. rodentium (†*, n = 3)) in the pectin-treated samples (n = 3). E, effect of pectin treatment on bacterial binding. Paraffin-embedded sections prepared from uninfected (N) and pectin-untreated or pectin-treated 12-days post-infected mouse distal colons were stained with antibody to LPS and counter-stained with hematoxylin to label the nuclei (n = 3; bar, 100 μm).
FIGURE 9.
FIGURE 9.
Proposed mechanism of NF-κB activation in response to CR infection in vivo. In response to infection of Swiss Webster mice by C. rodentium, intracellular signaling via MEK/ERK and p38 pathways may lead to sustained levels of these kinases thereby affecting NF-κB activity in the colonic crypts. The solid arrows represent pathways that are more apparently active in the colonic crypts, and broken arrows represent pathways most likely contributing toward NF-κB activation in vivo. A and B represent possible mechanism for activation of NF-κB either during progression or both during progression and regression of hyperplasia. Both MEK1/2 inhibitor PD98059 and 6% pectin diet can significantly inhibit NF-κB activity in the colonic crypts in response to C. rodentium infection.

Similar articles

Cited by

References

    1. Risio M., Lipkin M., Candelaresi G., Bertone A., Coverlizza S., Rossini F. P. (1991) Cancer Res. 51, 1917–1921 - PubMed
    1. Vogelstein B., Kinzler K. W. (1994) Cold Spring Harbor Symp. Quant. Biol. 59, 517–521 - PubMed
    1. Peifer M. (1995) Trends Cell Biol. 5, 224–229 - PubMed
    1. Stewart D. B., Nelson W. J. (1997) J. Biol. Chem. 272, 29652–29662 - PubMed
    1. Blobe G. C., Obeid L. M., Hannun Y. A. (1994) Cancer Metastasis Rev. 13, 411–431 - PubMed

Publication types

MeSH terms

Substances

LinkOut - more resources