. 2010 Sep;12(9):886-93.
doi: 10.1038/ncb2092. Epub 2010 Aug 15.

Live-cell imaging RNAi screen identifies PP2A-B55alpha and importin-beta1 as key mitotic exit regulators in human cells

Affiliations

Live-cell imaging RNAi screen identifies PP2A-B55alpha and importin-beta1 as key mitotic exit regulators in human cells

Michael H A Schmitz et al. Nat Cell Biol. 2010 Sep.

Abstract

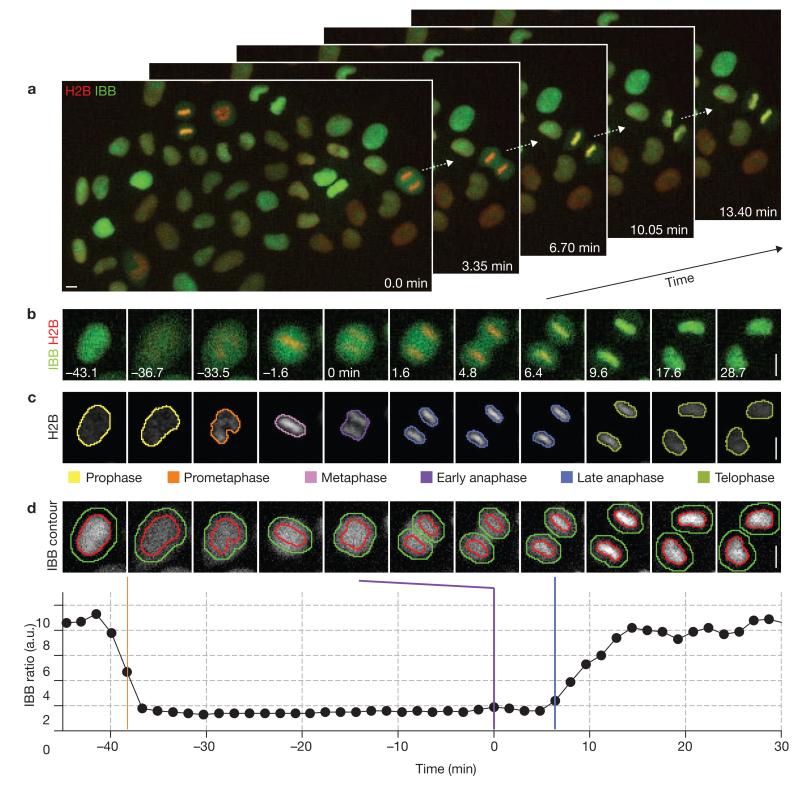
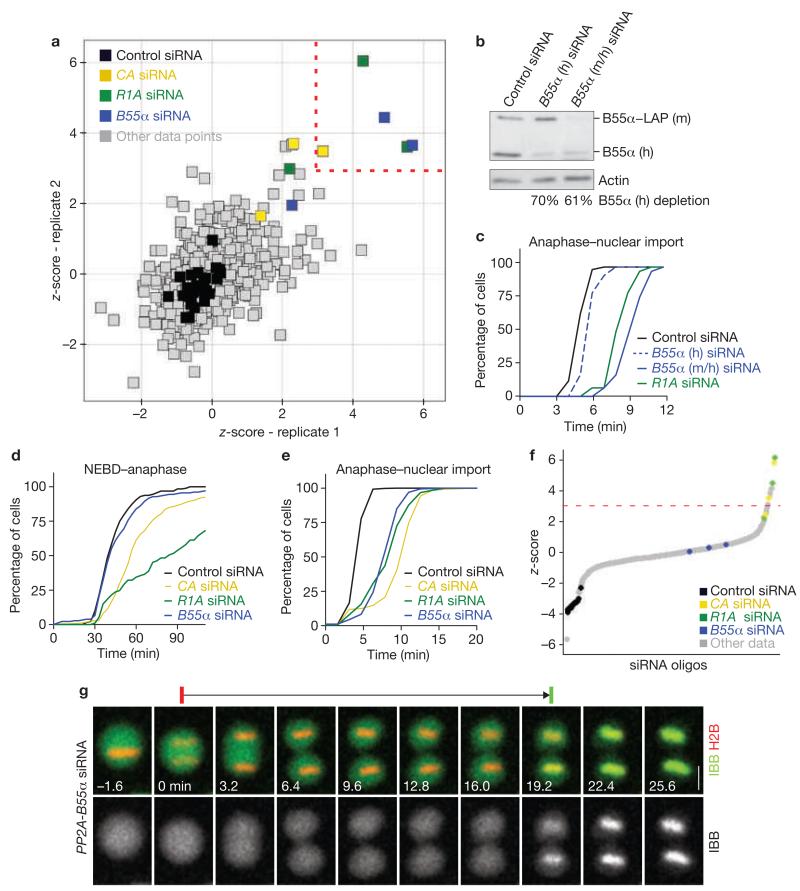
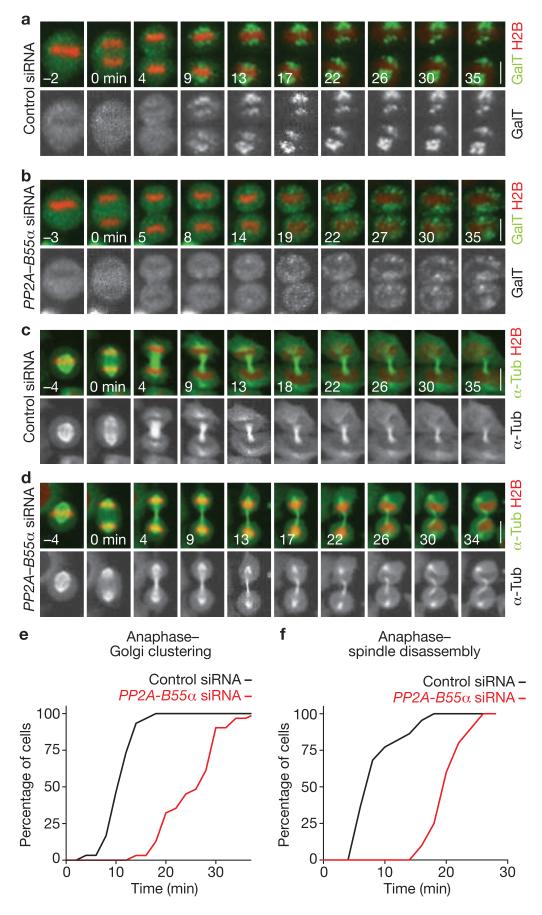
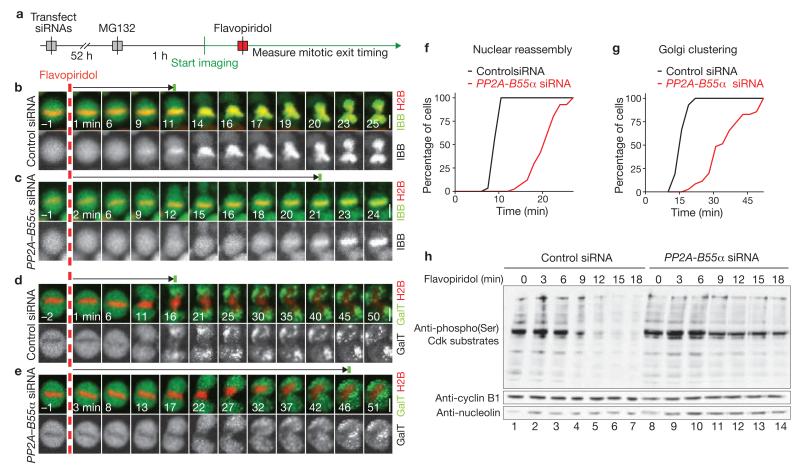
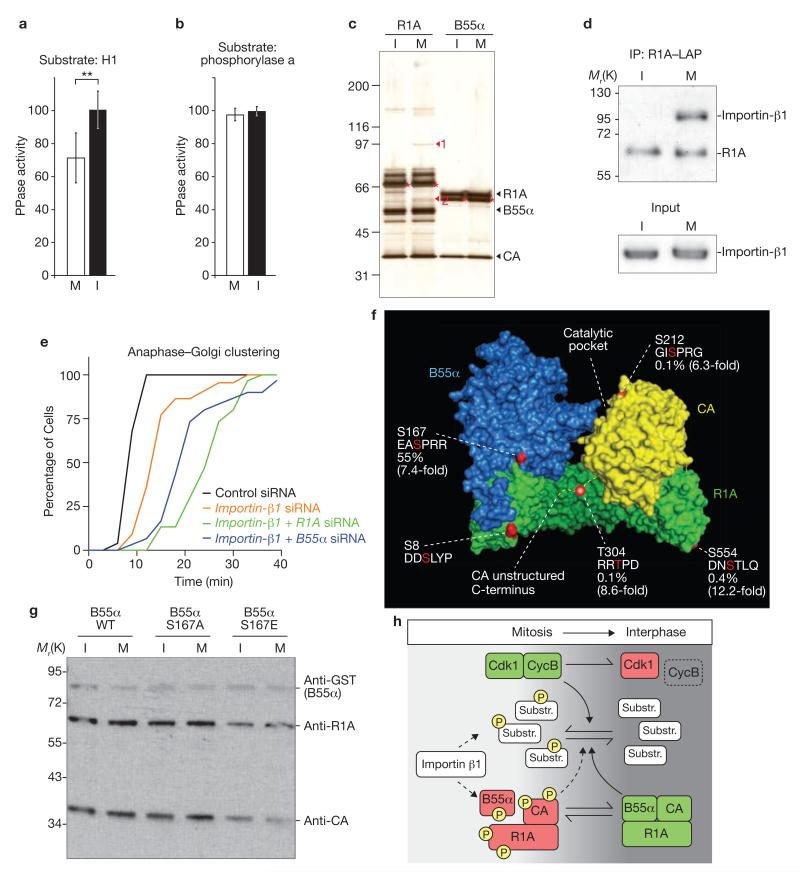
When vertebrate cells exit mitosis various cellular structures are re-organized to build functional interphase cells. This depends on Cdk1 (cyclin dependent kinase 1) inactivation and subsequent dephosphorylation of its substrates. Members of the protein phosphatase 1 and 2A (PP1 and PP2A) families can dephosphorylate Cdk1 substrates in biochemical extracts during mitotic exit, but how this relates to postmitotic reassembly of interphase structures in intact cells is not known. Here, we use a live-cell imaging assay and RNAi knockdown to screen a genome-wide library of protein phosphatases for mitotic exit functions in human cells. We identify a trimeric PP2A-B55alpha complex as a key factor in mitotic spindle breakdown and postmitotic reassembly of the nuclear envelope, Golgi apparatus and decondensed chromatin. Using a chemically induced mitotic exit assay, we find that PP2A-B55alpha functions downstream of Cdk1 inactivation. PP2A-B55alpha isolated from mitotic cells had reduced phosphatase activity towards the Cdk1 substrate, histone H1, and was hyper-phosphorylated on all subunits. Mitotic PP2A complexes co-purified with the nuclear transport factor importin-beta1, and RNAi depletion of importin-beta1 delayed mitotic exit synergistically with PP2A-B55alpha. This demonstrates that PP2A-B55alpha and importin-beta1 cooperate in the regulation of postmitotic assembly mechanisms in human cells.


Figures

Figure 1
Figure 1
Live-cell imaging assay of mitotic exit timing. (a) Automated time-lapse microscopy imaging of a HeLa cell line stably expressing a chromatin marker (H2B–mCherry; red) and a nuclear import substrate (IBB–eGFP; green). The selected images show approximately 13% of a movie field-of-view. For full movie, see Supplementary Information, Movie S1. (b) Time-lapse microscopy of a single cell progressing through mitosis; onset of anaphase is marked as 0 min. (c) Automated detection of chromatin regions, tracking of cells over time, annotation of mitotic stages and classification of chromatin morphologies by supervised machine learning. For full movie, see Supplementary Information, Movie S2. (d) Automated detection of nuclear breakdown and reassembly. Chromatin regions (red outline) were defined by automated segmentation of the chromatin-associated H2B–mCherry fluorescence (as shown in c). Cytoplasmic regions (green outline indicates outer boundary, red outline is inner boundary) were derived by dilation of the chromatin regions. The ratio of mean IBB–eGFP fluorescence in chromatin versus cytoplasmic regions served to automatically determine nuclear envelope breakdown (orange bar) and reformation after anaphase (nuclear import of IBB, blue bar). Anaphase onset was defined by the classification of chromatin morphology (violet bar, see c). a.u., arbitrary units. Scale bars, 10 μm.
Figure 2
Figure 2
RNAi screen for mitotic exit regulators. (a) RNAi screen of a genome-wide library of annotated protein phosphatases using the mitotic exit assay shown in Figure 1. Individual data points correspond to the z-score based on the mean mitotic exit timing in individual movies, determined in two experimental replicates. Negative controls are black. siRNA oligos that resulted in phenotypes reproducibly scoring a z-score threshold of > 3 (dashed lines) were considered as hits (highlighted by colours as indicated in legend; siRNAs targeting the same genes as the hits but with z-scores below threshold are also highlighted). (b) RNAi depletion of B55α in a HeLa cell line stably expressing LAP-tagged mouse-B55α from a bacterial artificial chromosome (BAC; for localization see Supplementary Information, Fig. S6b). Cells were transfected with siRNA targeting either human B55α alone (B55α h), or both mouse- and human-B55α (B55α m/h). A quantitative western blot is shown, probed with an anti-B55α antibody that recognizes both mouse- and human-B55α. (c) Rescue of mitotic exit delay phenotype by exogenous B55α. HeLa cells expressing mouse-B55α–LAP were RNAi-depleted for human (h) or mouse/human (m/h) B55α (as validated in b), or for the scaffolding subunit of PP2A (R1A), and the timing of mitotic exit was then assessed. (d) Cumulative histograms for early mitotic progression. Nuclear envelope breakdown until anaphase onset was timed in control and RNAi-depleted HeLa cells stably expressing H2B–mCherry and IBB–eGFP (as in Figure 1; n ≥ 64, under all conditions). (e) Cumulative histograms of mitotic exit. Anaphase onset until nuclear import of IBB–eGFP was measured for the same cells shown in d. (f) Synthetic depletion RNAi screen for mitotic exit phosphatases. Assay, sample preparation and siRNA library was identical to the screen shown in a, except that siRNA targeting B55α was co-transfected in each experimental condition. Negative controls (black) were transfected by only non-targeting siRNA. The plot shows the ranked z-scores of a single replicate, calculated as in a. Dashed line indicates z-score threshold. (g) Time-lapse microscopy images of a cell depleted of all three PP2A–B55α subunits progressing from anaphase through mitotic exit (as indicated by red and green bars above the images). Full movie shown in Supplementary Information, Movie S4. For negative control, see Supplementary Information, Movie S3. Scale bar, 10 μm. Uncropped image of blot is shown in Supplementary Information, Fig. S9a.
Figure 3
Figure 3
PP2A–B55α controls postmitotic Golgi assembly, spindle breakdown and chromatin decondensation. (a) Images from a confocal microscopy time-lapse movie of a control cell expressing H2B–mCherry and the Golgi marker, GalT–eGFP (for full movie, see Supplementary Information, Movie S5). Golgi reassembly was scored based on clustering of the fluorescence into two distinct patches per cell (t = 9 min). (b) Golgi reassembly in a PP2A–B55α-depleted cell (for full movie, see Supplementary Information, Movie S6). (c) Confocal microscopy time-lapse images of mitotic spindle disassembly and chromosome decondensation in a control cell (for full movie, see Supplementary Information, Movie S7). Spindle disassembly was scored based on the first apparent detachment of spindle-pole-associated microtubules from chromatin masses (t = 9 min). (d) Mitotic spindle disassembly in a PP2A–B55α-depleted cell (for full movie, see Supplementary Information, Movie S8). (e, f) Cumulative histograms of postmitotic Golgi clustering (e), or spindle disassembly (f) relative to anaphase onset (t = 0 min). Scale bars, 10 μm.
Figure 4
Figure 4
PP2A–B55α functions downstream of Cdk1 inactivation. (a) Experimental protocol for observation of mitotic exit induced by chemical inactivation of Cdks in absence of proteasome-mediated degradation. MG132 is the proteasome inhibitor and flavopiridol is the Cdk inhibitor. (b, c) Time-lapse microscopy images of cells expressing H2B–mCherry and IBB–eGFP. A control cell is shown in b (for full movie, see Supplementary Information, Movie S9) and a cell transfected with siRNA targeting PP2A–B55α is shown in c (for full movie, see Supplementary Information, Movie S10). Dashed red line indicates addition of flavopiridol, green bar indicates onset of IBB–eGFP nuclear import. (d, e) Golgi reassembly after chemically induced mitotic exit in cells expressing H2B–mCherry and the Golgi marker, GalT–eGFP. A control cell is shown in d and a cell transfected with siRNA targeting PP2A–B55α is shown in e. Dashed red line indicates addition of flavopiridol, green bar indicates onset of Golgi clustering. (f, g) Cumulative histograms of nuclear reassembly timing (f) and Golgi reassembly timing (g) based on the data shown in b–e. (h) Detection of Cdk1 substrate phosphorylation by an anti-phosphorylated-Ser antibody that specifically recognizes the Cdk target sequence K/R-pS-P-X-K/R (where X is any residue and pS is phosphorylated Ser) on a western blot. Samples were prepared after chemical induction of mitotic exit in synchronized cells in presence of proteasome inhibitor as in a. In control cells, Cdk substrates dephosphorylate rapidly (Control siRNA, lanes 1–7). Cells depleted for PP2A–B55α show delayed dephosphorylation (lanes 8–14). Scale bars, 10 μm. Uncropped image of blot is shown in Supplementary Information, Fig. S9b.
Figure 5
Figure 5
Cell-cycle-dependent regulation of PP2A–B55α. (a, b) PP2A–B55α, isolated from nocodazol-treated mitotic (M) or unsynchronized interphase cells (I) by pulldown of GST–B55α, was assayed for (a) phosphatase activity towards Cdk1–cyclin B-phosphorylated histone H1 (n = 15, values indicate means ± s.d., asterisks denote P < 0.001; values normalized to interphase cells) and (b) activity towards its substrate, phosphorylase a (n = 3; values normalized to interphase cells. (c) Purification of PP2A complexes from interphase (I) or mitotic (M) HeLa cells stably expressing LAP-tagged R1A or B55α baits, resolved by SDS–PAGE and silver staining. Two mitosis-specific bands were identified by mass spectrometry: importin-β1 (1), and importin-α1 (2). Expected positions of the bands from endogenous PP2A subunits are indicated on the right and migration positions of mouse baits are marked with asterisks. (d) PP2A complexes were purified with R1A–LAP by immunoprecipitation and resolved on a western blot by probing with anti-R1A and anti-importin-β1 antibodies. (e) Importin-β1 function in mitotic exit. Cells expressing H2B–mCherry and GalT–eGFP were transfected with siRNAs as indicated. Timing from anaphase (t = 0 min) until Golgi reassembly was assayed as in Fig. 3 (n ≥ 30 for each condition). (f) Phosphorylation sites on PP2A–B55α were identified by mass spectrometry and are highlighted in red on the 3D structure of PP2A–B55α and in the associated primary sequences. The abundance of phosphorylated peptide in the mitotic sample was estimated by peak area quantification of the elution profiles and is indicated as percentage of total peptide based on elution profile peak area normalization. Mitotic phosphorylation increase (indicated in brackets) was estimated by comparing the normalized peak area quantifications of phosphorylated peptides in interphase with mitotic samples. (g) Phosphorylation of B55α Ser 167 affects PP2A complex assembly. GST-tagged wild-type-B55α or GST-tagged substitution mutants of B55α (a non-phosphorylatable S167A mutant or a phospho-mimicking S167E mutant) were isolated from unsynchronized (I) or mitotic (M) cells by GST-pulldown. PP2A subunits were detected on western blots by anti-GST, anti-R1A and anti-CA antibodies. (h) Model for mitotic exit control. Dephosphorylation of a broad range of mitotic Cdk1 substrates promotes reassembly of interphase cells during mitotic exit. A balance of kinase (Cdk1–cyclin B) and phosphatase (PP2A–B55α) activities determines the substrate dephosphorylation kinetics during mitotic exit. Green indicates activated state, red indicates lower activity and P indicates phosphorylation. Uncropped images of blot are shown in Supplementary Information, Fig. S9c.

References

    1. Morgan DO. The cell cycle: principles of control. Oxford University Press; 2007.
    1. Queralt E, Uhlmann F. Cdk-counteracting phosphatases unlock mitotic exit. Curr. Opin. Cell Biol. 2008;20:661–668. - PMC - PubMed
    1. Bollen M, Gerlich DW, Lesage B. Mitotic phosphatases: from entry guards to exit guides. Trends Cell Biol. 2009;19:531–541. - PubMed
    1. Trinkle-Mulcahy L, Lamond AI. Mitotic phosphatases: no longer silent partners. Curr. Opin. Cell Biol. 2006;18:623–631. - PubMed
    1. Wu JQ, et al. PP1-mediated dephosphorylation of phosphoproteins at mitotic exit is controlled by inhibitor-1 and PP1 phosphorylation. Nat. Cell Biol. 2009;11:644–651. - PMC - PubMed

Publication types

MeSH terms