. 2010 Sep;13(9):1144-9.
doi: 10.1038/nn.2620. Epub 2010 Aug 15.

Parallel processing of visual space by neighboring neurons in mouse visual cortex

Affiliations

Parallel processing of visual space by neighboring neurons in mouse visual cortex

Spencer L Smith et al. Nat Neurosci. 2010 Sep.

Abstract

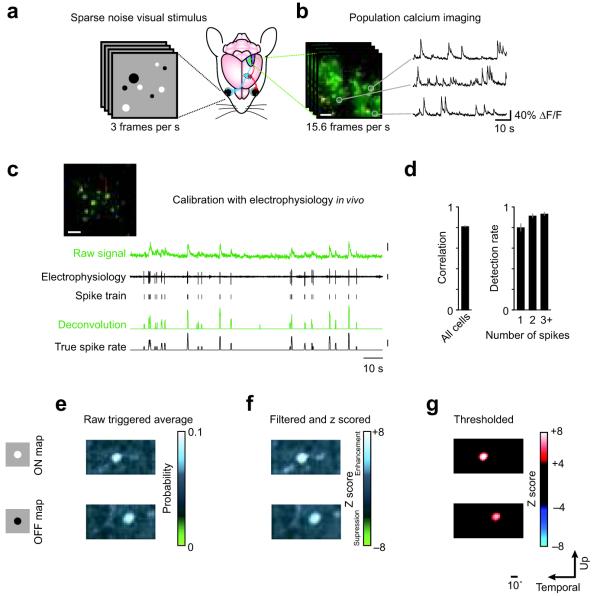
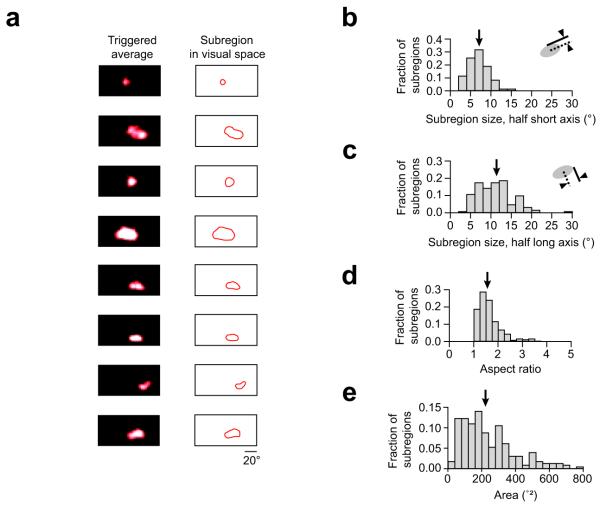
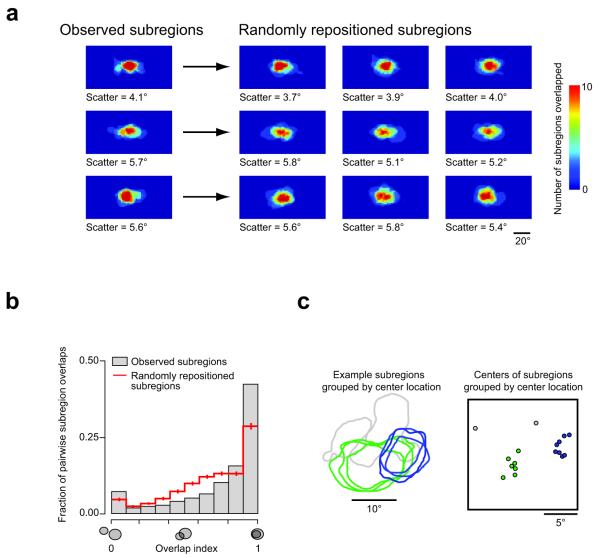
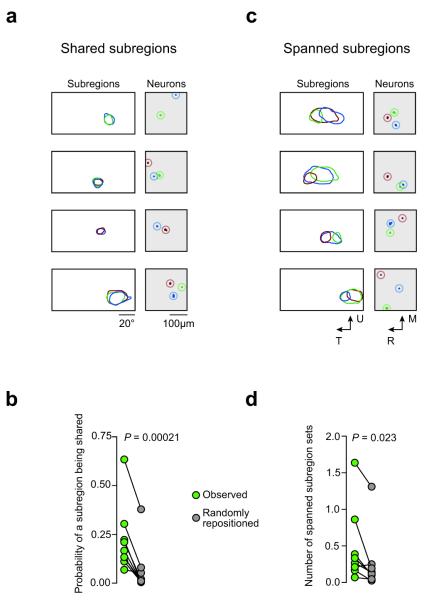
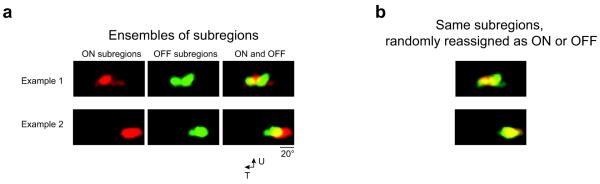
Visual cortex shows smooth retinotopic organization on the macroscopic scale, but it is unknown how receptive fields are organized at the level of neighboring neurons. This information is crucial for discriminating among models of visual cortex. We used in vivo two-photon calcium imaging to independently map ON and OFF receptive field subregions of local populations of layer 2/3 neurons in mouse visual cortex. Receptive field subregions were often precisely shared among neighboring neurons. Furthermore, large subregions seem to be assembled from multiple smaller, non-overlapping subregions of other neurons in the same local population. These experiments provide, to our knowledge, the first characterization of the diversity of receptive fields in a dense local network of visual cortex and reveal elementary units of receptive field organization. Our results suggest that a limited pool of afferent receptive fields is available to a local population of neurons and reveal new organizational principles for the neural circuitry of the mouse visual cortex.


Figures

Figure 1
Figure 1. Mapping receptive fields with population calcium imaging and sparse noise visual stimuli
(a) Sparse noise visual stimuli were presented to a mouse during (b) simultaneous population calcium imaging in visual cortex. (c) The calcium signals were deconvolved using parameters obtained from electrophysiology in order to obtain estimated spike rates. Scale bars in b and c: 20 μm; scale bars at right, top to bottom: 20% ΔF/F, 1 mV, 2 spikes/frame. (d) Left, the mean correlation coefficient between deconvolved calcium signals and spike rates obtained from simultaneous on-cell recordings was 0.81 ± 0.02. Right, detection reliability as a function of the number of spikes within one frame. Error bars are ± S.E.M. (e) Using the deconvolved calcium signals as an estimate of spike rate, a triggered average of stimulus frames was computed. Separate ON and OFF maps were generated for the white dots (top) and black dots (bottom), respectively. (f) This estimate was filtered using a Gaussian kernel and z scored using an area of the triggered average away from the RF. (g) This was then thresholded to obtain RFs.
Figure 2
Figure 2. Receptive field subregions obtained with population calcium imaging
(a) To illustrate the diversity of subregion sizes and shapes, a representative set of examples are shown, taken from eight different neurons across three different animals. For each example subregion, the z scored triggered average of stimulus frames (left) and the subregion outline used in subsequent analysis (right) are displayed next to each other. The third and sixth subregions are OFF subregions, the rest are ON subregions. For all subregions mapped (n = 228 subregions in 6 mice) we have plotted the distributions of various geometric parameters. (b) The half short axis length and (c) half long axis length, and (d) aspect ratio of elliptical fits to observed subregions. (e) Distribution of areas of RF subregions. Arrows indicate the mean of each histogram.
Figure 3
Figure 3. Substantial receptive field subregion overlaps occur more frequently than expected for random positioning
(a) Left, multiple (12 – 15) overlaid subregions (ON, OFF, OFF subregions, respectively) in three different mice are shown. For each point in space, the number of overlapping subregions is coded by color. Scatter is defined as the average deviation of each subregion center from the mean subregion center. Right, the subregions of each ensemble have been randomly repositioned three times. The random repositioning algorithm was designed to not change the scatter (across the full data set, scatter observed: 4.9 ± 0.8°, after repositioning: 4.9 ± 0.4°; mean ± S.E.M.; P = 0.99, Wilcoxon signed-rank test). Note that the random repositioning does not markedly alter the appearance of the ensembles. (b) Pairwise analysis, however, reveals that subregions overlapped more in their observed positions (grey bars) than when randomly repositioned (red line, error bars indicate S.D.; P < 10−5, Kolmogorov-Smirnov test). (c) Example of apparently shared subregions (left) and clustered subregion centers (right) in visual space. The subregion outlines and center markers have been color-coded by hand for clarity. The two gray subregion center markers on the right represent subregions (not shown) that do not appear to be shared with the green and blue groups.
Figure 4
Figure 4. Features of local receptive field organization: shared subregions and spanned subregions
(a) The left-hand panels show subregions of individual neurons (color-coded) which are shared. The right-hand panels show the relative position of the same neurons in visual cortex (same color code). Four examples are shown. (b) The number of shared subregions in the population is decreased when the subregions are randomly repositioned. Each point represents one ensemble of subregions. (c) In the case of spanned subregions, the subregion of one neuron overlaps two or more non-overlapping subregions from other neurons. Four examples are shown. (d) Again, the incidence of this spatial arrangement decreases when the subregions are randomly repositioned.
Figure 5
Figure 5. ON and OFF subregions are offset with respect to each other in visual space
(a) The ON subregions in each animal tend to cluster in an area of visual space spatially segregated from the OFF subregions that also cluster together. Data from two animals are shown, with overlap density represented by color intensity (example 1 consists of 15 ON subregions and 18 OFF subregions; example 2 consists of 19 ON subregions and 15 OFF subregions). (b) When the subregions are randomly reassigned as ON or OFF subregions, the spatial segregation is lost. The observed clustering was decreased by randomly reassigning subregions as ON or OFF (P < 0.02, bootstrap method, n = 4 mice).

Comment in

  • Zooming in on mouse vision.
    Sirotin YB, Das A. Sirotin YB, et al. Nat Neurosci. 2010 Sep;13(9):1045-6. doi: 10.1038/nn0910-1045. Nat Neurosci. 2010. PMID: 20740033 Free PMC article.

References

    1. Hubel DH, Wiesel TN. Receptive fields of single neurones in the cat’s striate cortex. The Journal of physiology. 1959;148:574–591. - PMC - PubMed
    1. Smith SL, Trachtenberg JT. Experience-dependent binocular competition in the visual cortex begins at eye opening. Nat Neurosci. 2007;10:370–375. - PubMed
    1. Kalatsky VA, Stryker MP. New paradigm for optical imaging: temporally encoded maps of intrinsic signal. Neuron. 2003;38:529–545. - PubMed
    1. Wagor E, Mangini NJ, Pearlman AL. Retinotopic organization of striate and extrastriate visual cortex in the mouse. J Comp Neurol. 1980;193:187–202. - PubMed
    1. Drager UC. Receptive fields of single cells and topography in mouse visual cortex. J Comp Neurol. 1975;160:269–290. - PubMed

Publication types