. 2010 Sep;7(9):741-6.
doi: 10.1038/nmeth.1492. Epub 2010 Aug 15.

High-resolution mapping of protein sequence-function relationships

Affiliations

High-resolution mapping of protein sequence-function relationships

Douglas M Fowler et al. Nat Methods. 2010 Sep.

Abstract

We present a large-scale approach to investigate the functional consequences of sequence variation in a protein. The approach entails the display of hundreds of thousands of protein variants, moderate selection for activity and high-throughput DNA sequencing to quantify the performance of each variant. Using this strategy, we tracked the performance of >600,000 variants of a human WW domain after three and six rounds of selection by phage display for binding to its peptide ligand. Binding properties of these variants defined a high-resolution map of mutational preference across the WW domain; each position had unique features that could not be captured by a few representative mutations. Our approach could be applied to many in vitro or in vivo protein assays, providing a general means for understanding how protein function relates to sequence.


Figures
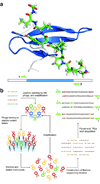
Figure 1
Figure 1. A Highly Parallel Assay For Exploring Protein Sequence-Function Relationships
(a) The NMR structure of the hYAP WW domain (Protein Data Bank identifier 1jmq) is shown, as a cartoon, in complex with its peptide ligand (www.pymol.org). In both the structure and the schematic below, the blue portion of the hYAP WW domain indicates the mutagenized and sequenced region. (b) A library of variant WW domains was generated using chemical DNA synthesis with doped nucleotide pools, amplified using PCR and then displayed as a fusion to the capsid protein of T7 bacteriophage. The input phage library was subjected to successive rounds of selection. Each round consisted of phage binding to peptide ligand immobilized on beads, washing to remove unbound phage, and elution and amplification of bound phage. Sequencing libraries were created using PCR from the input phage and the phage after three and six rounds of selection, and were sequenced using overlapping paired-end reads on the Illumina platform. An example of four unique variants of differing affinity are shown in different colors. The green arrows indicate the location of the sequencing primers.
Figure 2
Figure 2. Comparison of Mutational Tolerance and Evolutionary Conservation in the WW Domain
(a) The mutational diversity of the input, round three and round six WW domain libraries is shown. Mutations are enumerated by position within the domain and by amino acid substitution. (b) Shown is a ratio of mutational frequencies (round six/input) observed at each position within the WW domain. Positions intolerant to mutation are shown as blue bars; beneficial mutations are shown as red bars. Positions making substantial contact with the peptide are underlined. (c) We compared the mutational preference at each position of the hYAP65 WW domain (top sequence) to a consensus WW domain sequence (bottom sequence). Positions where the hYAP65 sequence is identical to the consensus and that are mutationally intolerant in our assay are highlighted in blue. Using mutational frequencies for enriched variants, we generated a logo plot that indicates mutational preference at each position (i.e. the plot shows only mutations that are advantageous). Positions where mutations to the consensus sequence are beneficial are highlighted in green. A plot of conservation is shown as a percent of sequences in the alignment that are identical to the consensus at each position. (d) The mutational frequency ratio data from (b) were projected (log2 transformed) onto the space-filling model of the hYAP65 WW domain NMR structure (Protein Data Bank identifier 1jmq) using the PyMOL software (www.pymol.org). Positions at which the frequency of mutations increase are shown in red and positions at which the frequency of mutations decrease are shown in blue.
Figure 3
Figure 3. A Comprehensive Sequence-Function Map of the WW Domain
We calculated enrichment ratios (round six/input) for each amino acid at each position within the WW domain. Each panel of the plot corresponds to a different amino acid substitution profile, whose three letter code is displayed in the header bar. The x-axis of each panel indicates the position, from left to right, along the WW domain while the y-axis indicates log2(enrichment ratio). Blue dots indicate a measured enrichment ratio and red dots indicate the wild type sequence, which enriched 1.7-fold. Gray dots indicate mutations not observed, and were arbitrarily placed at zero. The upper left panel of the plot corresponds to a traditional alanine scan of the WW domain.
Figure 4
Figure 4. Prediction of WW Domain Folding Energies and Double Mutant Enrichment Ratios
The Rosetta framework was used to calculate folding energies for the 16,363 full-length WW domain variants that were significantly enriched or depleted after six rounds of selection. Predicted folding energies relative to the wild type WW domain energy are plotted against the observed fitness (variant/wild type) for the variants containing one (red), two (blue), or more mutations (gray). (b) Using a basis set of single mutant enrichment ratios, we predicted double mutant enrichment ratios using a product model.

References

    1. Sidhu SS, Koide S. Phage display for engineering and analyzing protein interaction interfaces. Curr. Opin. Struct. Biol. 2007;17:481–487. - PubMed
    1. Matouschek A, Kellis JT, Jr, Serrano L, Fersht AR. Mapping the transition state and pathway of protein folding by protein engineering. Nature. 1989;340:122–126. - PubMed
    1. Cunningham BC, Wells JA. High-resolution epitope mapping of hGH-receptor interactions by alanine-scanning mutagenesis. Science. 1989;244:1081–1085. - PubMed
    1. Levin AM, Weiss GA. Optimizing the affinity and specificity of proteins with molecular display. Mol. Biosyst. 2006;2:49–57. - PubMed
    1. Pal G, Kouadio JL, Artis DR, Kossiakoff AA, Sidhu SS. Comprehensive and quantitative mapping of energy landscapes for protein-protein interactions by rapid combinatorial scanning. J. Biol. Chem. 2006;281:22378–22385. - PubMed

Publication types