. 2010 Aug 12;6(8):e1001061.
doi: 10.1371/journal.pgen.1001061.

Telomere disruption results in non-random formation of de novo dicentric chromosomes involving acrocentric human chromosomes

Affiliations

Telomere disruption results in non-random formation of de novo dicentric chromosomes involving acrocentric human chromosomes

Kaitlin M Stimpson et al. PLoS Genet. .

Abstract

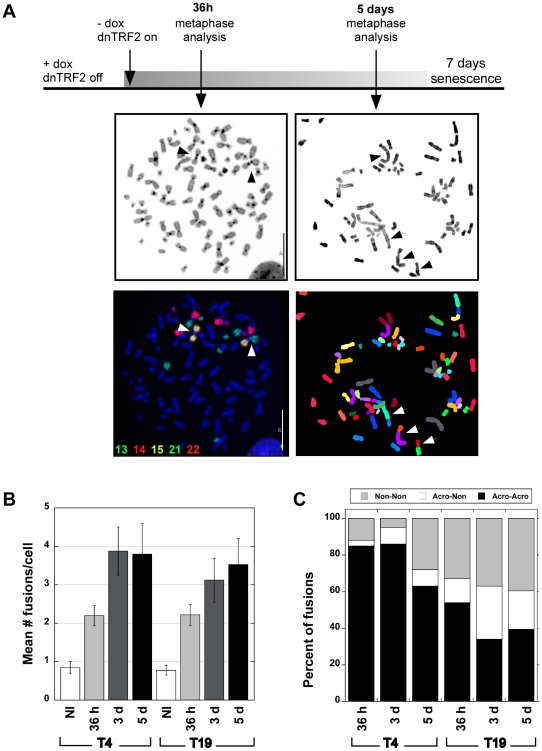
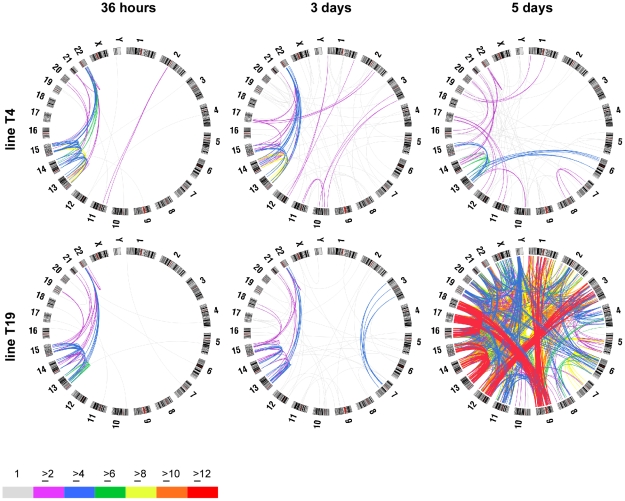
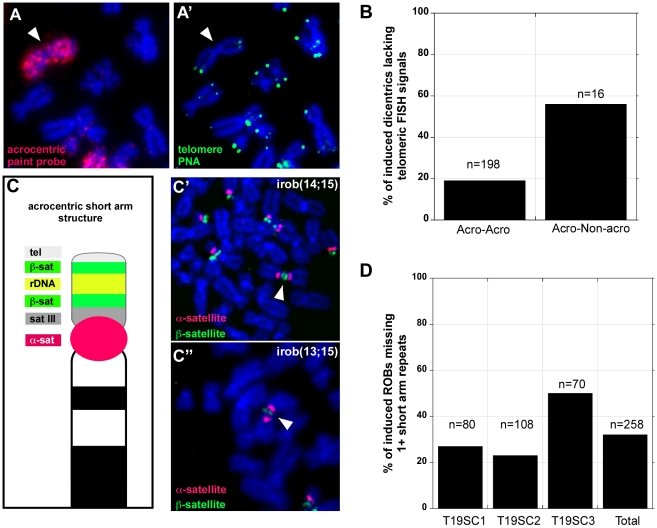
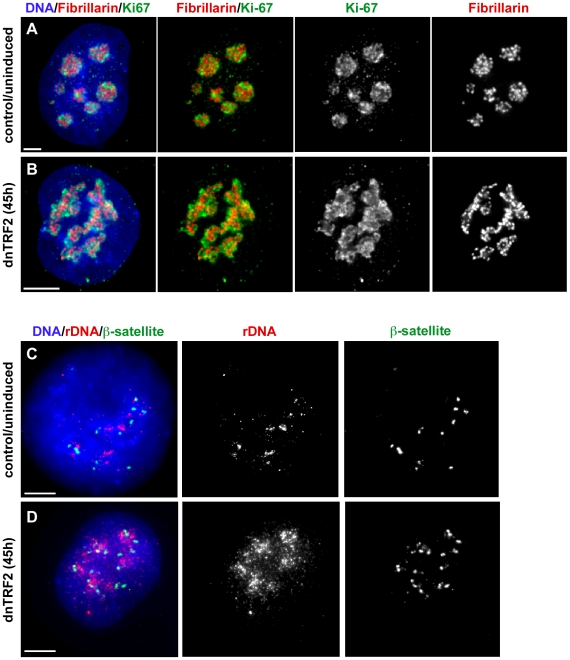
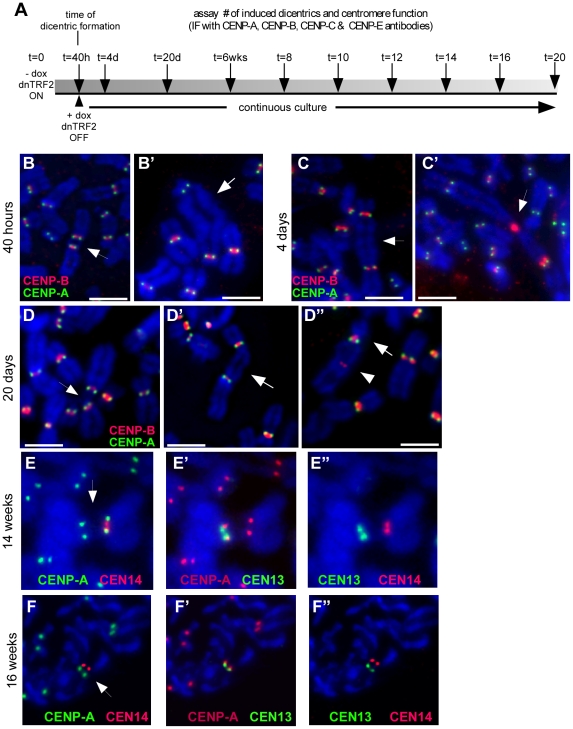
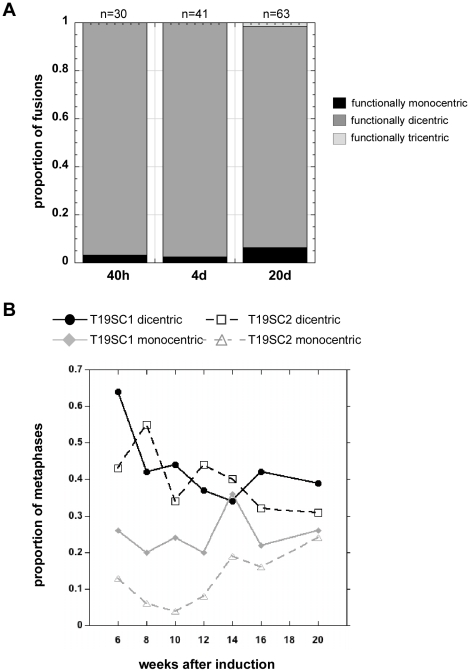
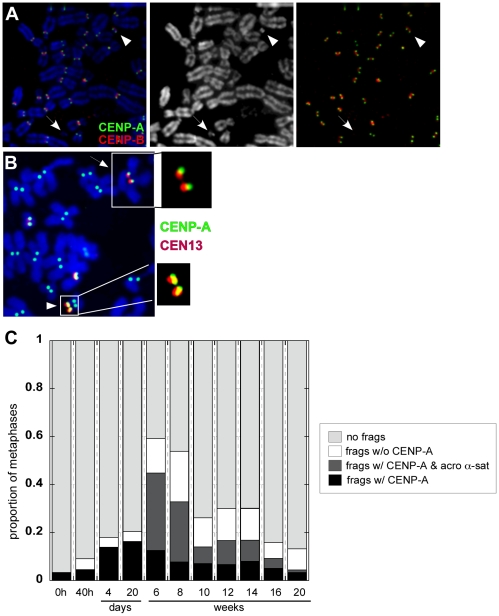
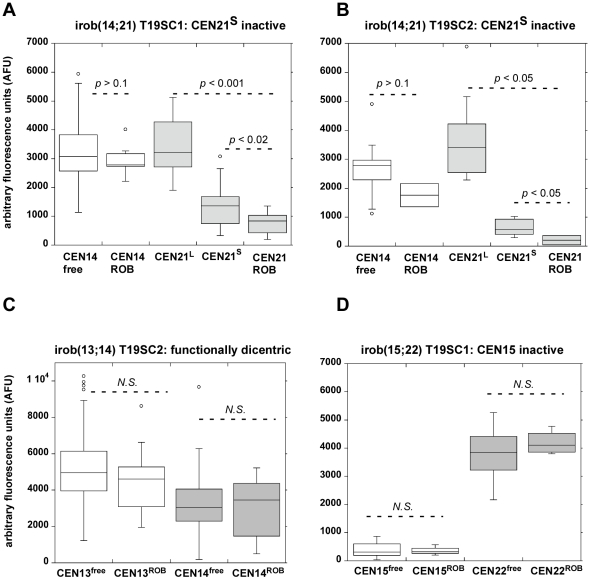
Genome rearrangement often produces chromosomes with two centromeres (dicentrics) that are inherently unstable because of bridge formation and breakage during cell division. However, mammalian dicentrics, and particularly those in humans, can be quite stable, usually because one centromere is functionally silenced. Molecular mechanisms of centromere inactivation are poorly understood since there are few systems to experimentally create dicentric human chromosomes. Here, we describe a human cell culture model that enriches for de novo dicentrics. We demonstrate that transient disruption of human telomere structure non-randomly produces dicentric fusions involving acrocentric chromosomes. The induced dicentrics vary in structure near fusion breakpoints and like naturally-occurring dicentrics, exhibit various inter-centromeric distances. Many functional dicentrics persist for months after formation. Even those with distantly spaced centromeres remain functionally dicentric for 20 cell generations. Other dicentrics within the population reflect centromere inactivation. In some cases, centromere inactivation occurs by an apparently epigenetic mechanism. In other dicentrics, the size of the alpha-satellite DNA array associated with CENP-A is reduced compared to the same array before dicentric formation. Extra-chromosomal fragments that contained CENP-A often appear in the same cells as dicentrics. Some of these fragments are derived from the same alpha-satellite DNA array as inactivated centromeres. Our results indicate that dicentric human chromosomes undergo alternative fates after formation. Many retain two active centromeres and are stable through multiple cell divisions. Others undergo centromere inactivation. This event occurs within a broad temporal window and can involve deletion of chromatin that marks the locus as a site for CENP-A maintenance/replenishment.


Conflict of interest statement

The authors have declared that no competing interests exist.

Figures

Figure 1
Figure 1. Human dicentric chromosomes are formed after transient TRF2ΔBΔM (dnTRF2) expression.
(A) Scheme for generating de novo dicentrics in HTC75 fibrosarcoma cells using inducible expression of mutant TRF2 (TRF2ΔBΔM). Short-term induction (36 hour) of dnTRF2 produced primarily dicentric chromosomes (arrowheads). Extended expression of dnTRF2 (5 days) resulted in multi-chromosome/multi-centric fusions (arrow). Chromosome fusions were identified using FISH with chromosome-specific painting probes and/or M-FISH. The gray-scale panel shows the DAPI-stained chromosomes from the same FISH image located below. The DAPI image was inverted (from black to white background) to reveal banding patterns on chromosomes. Scale bars = 20 µm. (B) Transient dnTRF2 expression generated ∼2 fusions per cell in two independently induced HTC75 clones, T4 and T19. Over 20 metaphases were analyzed for each time point (NI = not induced). (C) After short-term (36 hour) expression of dnTRF2 in independent inductions of T4 and T19, over 80% of fusions involved acrocentric chromosomes (black bars). As dnTRF2 expression extended to 3 days (3d) and 5 days (5d), the number of non-acrocentric fusions contributed to a greater proportion of the total fusions.
Figure 2
Figure 2. Circular maps illustrating chromosome fusions that occur after short- and long-term expression of dnTRF2.
FISH was used to determine the frequency of specific chromosome fusions. Over 1000 fusions were scored in these analyses (≥25 metaphase/timepoint/cell line). Circle plots were generated using Circos (http://mkweb.bcgsc.ca/circos/) to visualize chromosome fusions over time after dnTRF2 expression. Chromosomes are shown along the outside of the circles. The lines are intended to represent fusions between specific chromosomes but do not designate precise breakpoints; line colors represent numbers of fusions (see color key). Acrocentric chromosome fusions represented the major fraction of dicentrics in short inductions of subclones T4 (top row) and T19 (bottom row). At 36 hours, most fusions occurred between acrocentrics. After 3- or 5-day dnTRF2 inductions, the percentage of non-acrocentric fusions increased. This is evident in the 5-day induction of T19 in which acrocentric interactions predominate (red lines), but HSA1-HSA9, HSA3-HSA12 and HSA9-HSA18 fusions also occurred frequently.
Figure 3
Figure 3. Heterogeneity in iROB structure: only half of induced dicentrics are true telomere-telomere fusions.
(A, A′) FISH with PNA-telomere (green) and acrocentric painting (red) probes illustrated that an irob(14;14) lacked detectable telomeric repeats at the short arm fusion point. (B) Almost 20% of iROBs, and >50% of non-acrocentric-acrocentric fusions lacked telomeric FISH signals at the fusion breakpoints. (C) Schematic of acrocentric genomic organization. Multiple satellite repeats are located on all of the short arms of each acrocentric. (C′) FISH with acrocentric short arm specific probes revealed that an irob(14;15) retained distal ß-satellite array (green), implying that all repeats between the centromere (α-satellite, red) and the distal ß-satellite array were present on the iROB. (C″) Conversely, an irob(13;15) retained only a small amount of proximal ß-satellite (green) on only one of the acrocentrics, indicating heterogeneity in molecular structure of iROBs. (D) In three induced T19 subclones, FISH was used to assess the presence of acrocentric sequences on individual ROBs. Between 20% and 50% of iROBs lacked one or more short arm repeats.
Figure 4
Figure 4. dnTRF2 expression alters nucleolar and acrocentric short arm architecture.
Nucleoli in 3-D preserved cells isolated after 45 hours of dnTRF2 expression were identified in intact nuclei using immunostaining for fibrillarin (red) and Ki-67 (green). (A) In control (uninduced) cells, the nucleolus appeared as multiple punctate lobes in which fibrillarin and Ki-67 were intertwined. (B) In cells expressing dnTRF2, nucleolar morphology was abnormal, appearing as unraveled “nucleolar necklaces” rather than punctate structures in the center of the nucleus. (C) FISH with ß-satellite and rDNA probes on interphase nuclei showed that acrocentric repeat arrays normally appeared as tightly compacted foci. (D) ß-satellite (green) and rDNA (red) arrays were widely dispersed throughout the nucleus after expression of dnTRF2 for 45 hours, indicating that telomere dysfunction induced by mutant TRF2 disrupted normal nuclear organization. Scale bars for all panels = 5 µm.
Figure 5
Figure 5. Centromere function of induced dicentrics.
(A) Scheme of experimental strategy to produce de novo dicentrics for which centromere function and mitotic stability were monitored every 2 weeks (wks) for a total of 20 weeks. Centromere function was assayed by immunostaining for various centromere proteins (CENPs). Centromeric DNA regions were identified using CENP-B immunostaining or FISH with α-satellite–specific DNA probes. (B) Assessment of centromere function using immunostaining for CENP-A (green) and CENP-B (red). CENP-A identifies functional centromeres. CENP-B is an α-satellite DNA binding protein that binds to both active and inactive centromeres. After 40 hours (40h) of dnTRF2 expression, dicentrics were formed, including iROBs (B) and dicentrics involving non-acrocentric chromosomes (B′). Each type of dicentric, denoted by arrows, had two active centromeres. Scale bars = 7.5 µm. (C) At 4 days (4d) after dicentric formation, functionally dicentric chromosomes were still observed, including on chromosomes with two distantly located centromeres (C, arrow). Some cells also contained structurally tricentric chromosomes, as shown in (C′, arrow). In this case, one centromere was inactivated, since it exhibited immunostaining for CENP-B only. Scale bar in C = 5 µm; in C′ = 7.5 µm. (D) Several types of functionally dicentric chromosomes persisted even at 20 days (20d) after formation. These included iROBs (D) and non-acrocentric dicentrics with large inter-centromeric distances (D′). However, some functionally monocentric dicentrics were observed (D″), primarily among the non-acrocentric class of dicentrics. Arrows denote the chromosome fusion in each panel. Scale bars = 7.5 µm. (E) Assessment of centromere function on an irob(13;14) after 14 weeks of continuous culture (∼100 cell divisions). Centromeres were detected using FISH with α-satellite probes. CENP-A staining (green) appeared at the CEN14 (E, red). (E′) CENP-A (red) was also present at CEN13 (green), indicating that this iROB was functionally dicentric. (E″) This image shows the same iROB detected only with FISH probes to illustrate that CEN13 (green) and CEN14 (red) were spatially distinct. (F) Functionally monocentric iROBs were also detected during the timecourse experiment. Another irob(13;14), different than the one in (E), showed evidence of centromere inactivation. In (F), CENP-A (green) did not overlap with CEN14 (red). (F′) CENP-A (red) and CEN13 (green) co-localized, indicating the CEN13 was the functional centromere and CEN14 had been inactivated. (F″) This image shows the same iROB detected only with CEN13 (green) and CEN14 (red) FISH probes to illustrate that the centromeric arrays were spatially distinct.
Figure 6
Figure 6. Induced dicentrics are variably stable over time.
(A) The number of functionally monocentric, dicentric and tricentric chromosomes was monitored for 3 weeks after transient dnTRF2 expression. At 40 hours (40h) and after 4 days (4d) of continuous culture, nearly all structurally dicentric chromosomes remained functionally dicentric. By 20 days (20d), there was a noticeable increase in the proportion of functionally monocentric dicentrics. A functionally tricentric chromosome was seen at 20d. “n” represents the number of multicentrics (2+ centromeres) at each time point. (B) In longer-term experiments extending over a 14-week period, the proportion of functionally monocentric versus functionally dicentric iROBs was determined for subclones T19SC1 and T19SC2. These clonal lines were derived from two independent dnTRF2 short-term (36 hour) inductions. Overall, the number of functionally dicentric iROBs decreased (T19SC1) or stayed constant (T19SC2). The number of functionally monocentric iROBs increased in T19SC2. It should be noted that many cells contained more than one dicentric so that proportions will not add up to 1. Between 25 and 126 cells were scored at each timepoint for each cell line.
Figure 7
Figure 7. Dicentric stability is associated with chromosomal fragments.
(A) The appearance of small chromosome fragments either containing or lacking CENP-A (green) and CENP-B (red) was monitored over time, from the time of dicentric formation (40h) to 20 weeks. Arrowheads denote chromosome fragments. The DAPI image is shown in the middle panel. Combined CENP-A (green) and CENP-B (red) is shown in the far right panel. (B) At 16 weeks after formation of an irob(13;14), immunostaining for CENP-A followed by FISH with chromosome-specific α-satellite probes revealed that CENP-A did not co-localize with CEN13 (arrow; see enlargement of centromeric region). A small CEN13 fragment that was CENP-A-positive (arrowhead; see enlargement of CENP-A/α-satellite signal of fragment) was present in the same cell. This chromosomal fragment was hypothesized to have originated from the inactivated CEN13 of the iROB. (C) Chromosomal fragments, with and without CENP-A and acrocentric α-satellite DNA was monitored over time. CENP-A-positive chromosome fragments (black+dark gray bars), many of which corresponded to acrocentric α-satellite DNA (dark gray), were prevalent after dicentric formation. These fragments decreased after 20 weeks, suggesting that they were lost during cell division. Thirty to 270 cells per time point were analyzed.
Figure 8
Figure 8. Reduction in α-satellite DNA FISH signals suggests that partial centromeric deletion occurs at inactivated centromeres of iROBs.
Metaphases from control cells and from induced subclones T19SC1 and T19SC2 containing different versions of specific iROBs [irob(14;21) and irob(13;14)] were hybridized with chromosome-specific centromeric (α-satellite) probes. The integrated densities of the fluorescent α-satellite signals were measured in multiple cells on free-lying acrocentrics and the same chromosome after iROB formation. Fluorescence intensities in arbitrary fluorescence units (AFU) were displayed as box plots. The centromeres of the HSA21 homologues were visually distinct, in that one pair of homologues had a large α-satellite FISH signal, designated as CEN21L, while the other pair of homologues had a much smaller FISH signal (denoted as CEN21S) (see Figure S6 for additional information on identification of HSA21 homologues). P values indicating significant differences in fluorescence intensities were determined using the Mann-Whitney test. (A, B) In two independent versions of irob(14;21), CEN21 was identified as inactive by CENP-A immunostaining. Specifically, one CEN21S homologue appeared to be involved in the irob(14;21). The range of AFUs at the inactive CEN21 on the iROB was decreased compared to either free-lying CEN21L or CEN21S, suggesting that CEN21ROB had become smaller during or after iROB formation. The intensity of the CEN14 probe at the active CEN14 of the iROB (CEN14ROB) was not significantly (N.S.) different from CEN14 on free-lying HSA14 (CEN14free). (C) As validation for the quantitative assay, a functionally dicentric irob(13;14) was examined. Fluorescence intensities of centromeres on free-lying HSA13 (CEN13free) and on the iROB (CEN13ROB) were not statistically different. Similar fluorescence intensities were also observed when CEN14 FISH was compared on free-lying HSA14 and the irob(13;14). N.S. = not significant, p>0.1. (D) A different type of iROB, irob(15;22) in which CEN15 was inactive was analyzed. In this iROB, a significant difference between CEN15free and CEN15ROB was not detected, suggesting that inactivation had occurred by an epigenetic mechanism or deletion was below the level of FISH detection. N.S. = not significant, p>0.1.

References

    1. Hanahan D, Weinberg R. The hallmarks of cancer. Cell. 2000;100:57–70. - PubMed
    1. Mitelman F, Mertens F, Johansson B. A breakpoint map of recurrent chromosomal rearrangements in human neoplasia. Nat Genet. 1997;15:417–474. - PubMed
    1. Mitelman F. Recurrent chromosome aberrations in cancer. Mutation Research/Review in Mutation Research. 2000;462:247–253. - PubMed
    1. Hamerton J, Canning N, Ray M, Smith S. A cytogenetic survey of 14,069 newborn infants. I. Incidence of chromosome abnormalities. Clin Genet. 1975;8:223–243. - PubMed
    1. Robertson W. Chromosome studies. I. Taxonomic relationships shown in the chromosomes of Tettigidae and Acrididae. V-shaped chromosomes and their significant in Acrididae, Locustidae and Gryllidae: chromosome and variation. J Morph. 1916;27:179–331.

Publication types