. 2010 Aug 11;5(8):e12107.
doi: 10.1371/journal.pone.0012107.

Androgen-regulated expression of arginase 1, arginase 2 and interleukin-8 in human prostate cancer

Affiliations

Androgen-regulated expression of arginase 1, arginase 2 and interleukin-8 in human prostate cancer

Philippe O Gannon et al. PLoS One. .

Abstract

Background: Prostate cancer (PCa) is the most frequently diagnosed cancer in North American men. Androgen-deprivation therapy (ADT) accentuates the infiltration of immune cells within the prostate. However, the immunosuppressive pathways regulated by androgens in PCa are not well characterized. Arginase 2 (ARG2) expression by PCa cells leads to a reduced activation of tumor-specific T cells. Our hypothesis was that androgens could regulate the expression of ARG2 by PCa cells.

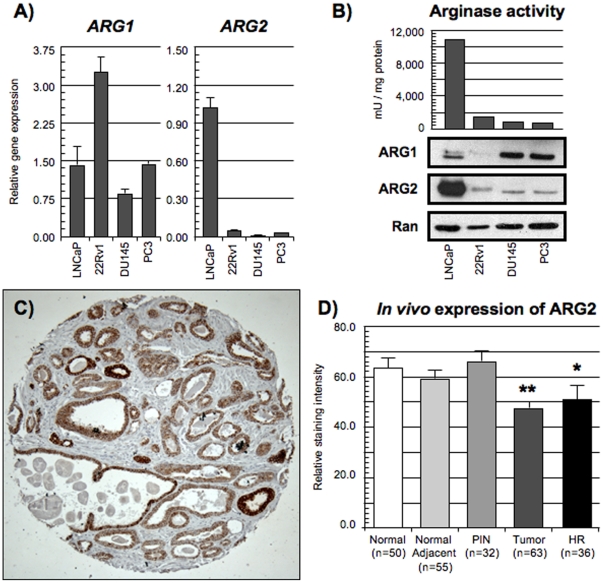
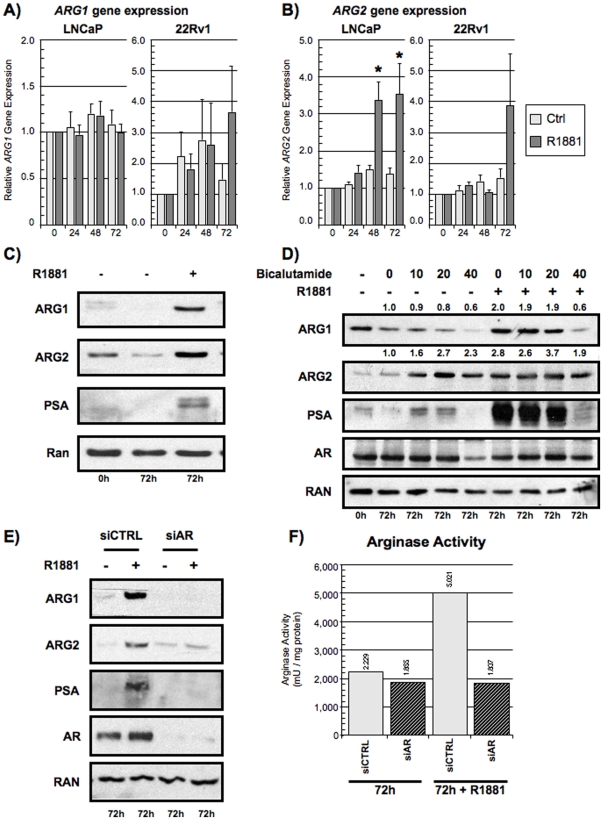
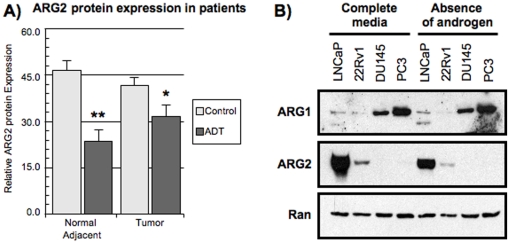
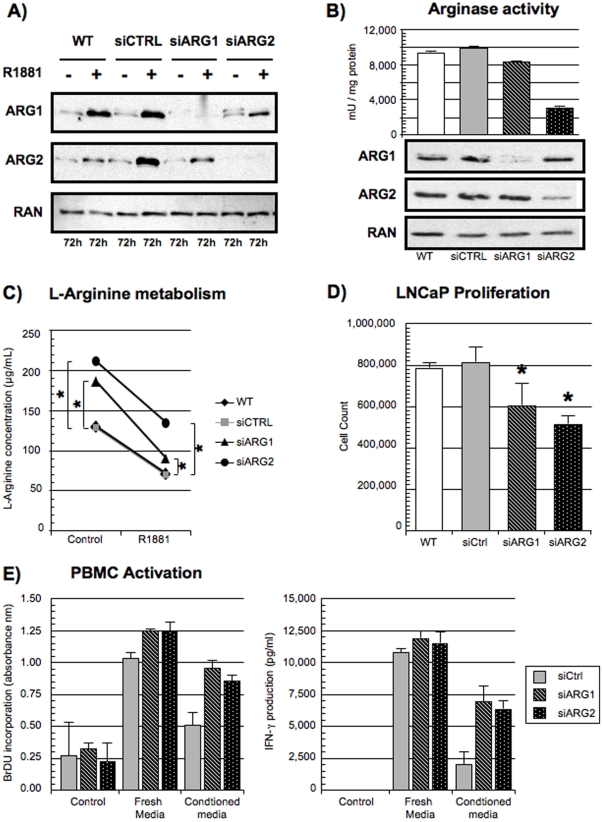
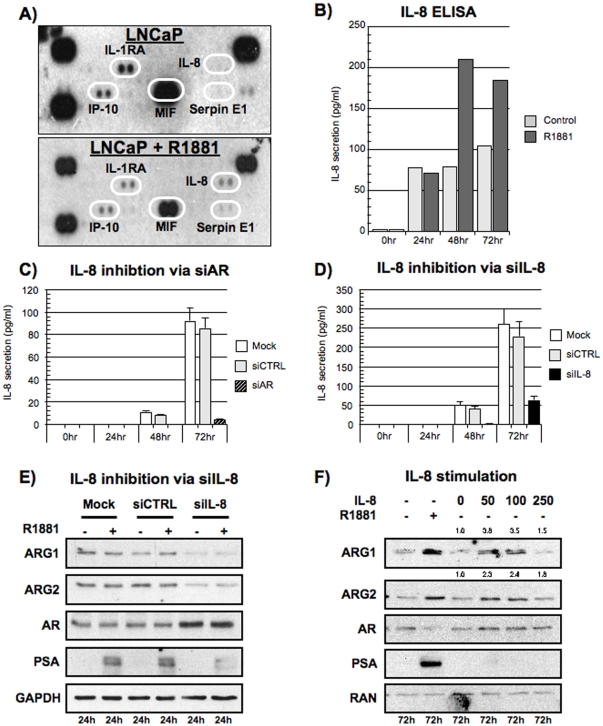
Methodology/principal findings: In this report, we demonstrate that both ARG1 and ARG2 are expressed by hormone-sensitive (HS) and hormone-refractory (HR) PCa cell lines, with the LNCaP cells having the highest arginase activity. In prostate tissue samples, ARG2 was more expressed in normal and non-malignant prostatic tissues compared to tumor tissues. Following androgen stimulation of LNCaP cells with 10 nM R1881, both ARG1 and ARG2 were overexpressed. The regulation of arginase expression following androgen stimulation was dependent on the androgen receptor (AR), as a siRNA treatment targeting the AR inhibited both ARG1 and ARG2 overexpression. This observation was correlated in vivo in patients by immunohistochemistry. Patients treated by ADT prior to surgery had lower ARG2 expression in both non-malignant and malignant tissues. Furthermore, ARG1 and ARG2 were enzymatically active and their decreased expression by siRNA resulted in reduced overall arginase activity and l-arginine metabolism. The decreased ARG1 and ARG2 expression also translated with diminished LNCaP cells cell growth and increased PBMC activation following exposure to LNCaP cells conditioned media. Finally, we found that interleukin-8 (IL-8) was also upregulated following androgen stimulation and that it directly increased the expression of ARG1 and ARG2 in the absence of androgens.

Conclusion/significance: Our data provides the first detailed in vitro and in vivo account of an androgen-regulated immunosuppressive pathway in human PCa through the expression of ARG1, ARG2 and IL-8.


Conflict of interest statement

Competing Interests: This project was funded in part by a Sanofi Aventis research grant (F.S.) and by a Canadian Uro-Oncology Group/AstraZeneca research award (F.S.). This does not alter the authors' adherence to all the PLoS ONE policies on sharing data and materials.

Figures

Figure 1
Figure 1. In vitro and in vivo expression of ARG1 and ARG2 in PCa.
PCa cell lines (LNCaP, 22Rv1, DU145 and PC3) were maintained in RPMI supplemented with 10% FBS. A) Gene expression of ARG1 (left panel) and ARG2 (right panel). Mean relative expression (n = 3) with standard error of the mean (error bars). B) Top panel: Arginase activity of PCa cell lines quantified in mU/mg of proteins. Bottom panel: Western blot of ARG1 and ARG2. Ran served as loading control. C) Representative image of immunohistochemistry staining of ARG2 expression in prostatic tissue. Note that the expression of ARG2 was confined to the epithelial cells with no stromal staining. D) Quantification of ARG2 expression by immunohistochemistry in prostate specimens. *Statistically significant difference in ARG2 expression between PIN and HR tissues (p = 0.033, Mann-U). **Statistically significant difference in ARG2 expression between tumor tissues and normal tissues (p<0.001, Mann-U), non-malignant tissues adjacent to tumor (p<0.01, Mann-U) and PIN tissues (p<0.001, Mann-U).
Figure 2
Figure 2. Androgen-regulated expression of ARG1 and ARG2.
A-B) LNCaP cells (left panels) and 22RV1 (right panels) were stimulated over a period of 72 hours with 10 nM R1881 following a 72 hour incubation period in charcoal-stripped media and the gene expression of A) ARG1 and B) ARG2 analyzed by qPCR. Control (light gray bars) and R1881-stimulated (black bars). *Statistically significant difference (p<0.05, Mann-U). Mean relative expression (n = 4) with standard error (error bars). C) Increased protein expression of both ARG1 and ARG2 following R1881 stimulation by Western blot. LNCaP cells were stimulated with 10 nM R1881 as previously described. PSA served as positive control. Representative experiment, (n = 6). D) Inhibition of AR activity with bicalutamide (Casodex). LNCaP cells were stimulated with R1881 for 72 hrs as previously described in the presence of increasing doses of bicalutamide (0, 10, 20 and 40 µM). ARG1 and ARG2 expression levels were evaluated by Western blot. Representative experiment is shown, (n = 3). Note the agonist effect of bicalutamide in the absence of R1881 illustrated by an increased PSA and ARG2 expression. E) Inhibition of AR expression by siRNA. LNCaP cells were transfected as previously described. AR, ARG1 and ARG2 expression levels were evaluated by Western blot. Representative experiment is shown, (n = 4). F) Arginase activity was quantified in mU/mg of proteins. LNCaP cells were transfected with siCTRL (light gray bars) or siAR (black bars) and then stimulated with R1881 for 72 hrs as previously described. Representative experiment, (n = 3).
Figure 3
Figure 3. Reduced ARG2 expression following ADT.
A) Analysis of androgen-regulated ARG2 expression in PCa patients by immunohistochemistry. Control patients (light gray bars, n = 40) and ADT-treated patients (black bars, n = 35). B) Decreased ARG2 protein expression in the absence of androgens in vitro determined by Western blot. Ran served as loading control. PCa cell lines (LNCaP, 22Rv1, DU145 and PC3) were maintained in RPMI 10% FBS or in RPMI supplemented with 10% charcoal stripped FBS for 7 days (n = 3). Note that ARG1 expression did not vary but that ARG2 was reduced in LNCaP and 22Rv1 cells in the absence of androgen.
Figure 4
Figure 4. ARG1 and ARG2 are metabolically active.
LNCaP cells were transfected with either a siCTRL or a cocktail of three siRNA against the ARG1 or ARG2. Post-transfection (24 hours), cells were plated in charcoal-stripped serum supplemented media for 72 hours and then stimulated for 72 hours with 10 nM R1881. A) siRNA inhibition of ARG1 and ARG2 expression was evaluated by Western Blot. Representative experiment is shown, (n = 4). B) Decreased arginase activity following transfection with siARG1 or siARG2 in LNCaP cells. The corresponding Western blot is shown in the bottom panel. Representative experiment is shown, (n = 3). C) Decreased metabolism of l-arginine in the absence of arginase expression. Conditioned media of LNCaP cells transfected with siCTRL, siARG1 or siARG2 were analyzed by HPLC for l-arginine concentration. The conditioned media analyzed by HPLC were from the LNCaP cells presented in Figure 4A. *Statistically significant difference (p<0.05, Mann-U). D) Decreased proliferation of LNCaP cells in the absence of arginase expression. LNCaP cells were transfected as previously described. Proliferation was measured by cell count 96 hours post-transfection. *Statistically significant difference (p<0.05, Mann-U), (n = 3). E) Inhibition of ARG2 expression causes increased PBMC proliferation and activation. PBMCs from normal donors were activated with anti-CD3 (OKT3, 1 µg/ml) with or without IL-2 in the presence of fresh media or conditioned media of LNCaP cells transfected with either control, siCTRL, siARG1 or siARG2 as previously described. Control PBMCs were incubated with IgG isotype control (1 µg/ml) and with PBS instead of IL-2. Left panel: PBMC proliferation was quantified by BrdU incorporation following 120 hours of OKT3 and IL-2 stimulation. Mean absorbance (n = 4) is shown with standard error (error bars). Right panel: PBMC secretion of IFN-γ quantified by ELISA. Same experiment as previously described, but the PBMCs were activated for 24 hours without IL-2. Representative expression is shown (n = 4) with standard error of the mean (error bars).
Figure 5
Figure 5. Androgens induced Interleukin-8, which in turn promotes ARG1 and ARG2 expression.
Evaluation of the cytokine expression profile of LNCaP cells following R1881 stimulation. A) Conditioned media of LNCaP cells stimulated as previously described were analyzed with a Proteome Profiler™ (R&D Systems). B) Conditioned media of LNCaP cells stimulated over time with either ethanol control (light gray bars) and R1881 (black bars) were analyzed for the production of IL-8 by ELISA. The representative experiment showed was performed with the same conditioned media used for the Proteome Profiler analysis in 5a, (n = 3). C) Quantification of IL-8 secretion by LNCaP cells transfected with siAR and stimulated with R1881 as previously described. Representative experiment is shown, (n = 3). D) Quantification of IL-8 secretion by LNCaP cells transfected with siIL-8 and stimulated with R1881 as previously described. Representative experiment is shown, (n = 3). For 5b and 5c, there was no IL-8 secretion detected in the absence of R1881 stimulation. E) Expression of ARG1 and ARG2 in LNCaP cells following transfection of siIL-8 and R1881 stimulation for 24 hours. Representative experiment is shown, (n = 3). F) LNCaP cells were plated in charcoal-stripped serum supplemented media for 72 hours and for 24 hours in serum-free RPMI. Cells were then stimulated for 72 hours with 10 nM R1881 or with 50, 100 or 250 ng/ml of IL-8 in serum-free RPMI. ARG1 and ARG2 expression levels were detected by Western blot. Representative experiment, (n = 3). Note the induction of both ARG1 and ARG2 at 50 and 100 ng/ml of IL-8 concentration in the absence of R1881.

Similar articles

Cited by

References

    1. Jemal A, Siegel R, Ward E, Hao Y, Xu J, et al. Cancer statistics, 2008. CA Cancer J Clin. 2008;58:71–96. - PubMed
    1. Grossmann ME, Huang H, Tindall DJ. Androgen receptor signaling in androgen-refractory prostate cancer. J Natl Cancer Inst. 2001;93:1687–1697. - PubMed
    1. Montironi R, Schulman CC. Pathological changes in prostate lesions after androgen manipulation. J Clin Pathol. 1998;51:5–12. - PMC - PubMed
    1. Chang SS, Kibel AS. The role of systemic cytotoxic therapy for prostate cancer. BJU Int. 2009;103:8–17. - PubMed
    1. Miller AM, Pisa P. Tumor escape mechanisms in prostate cancer. Cancer Immunol Immunother. 2007;56:81–87. - PMC - PubMed

Publication types