

Trypanosoma vivax infections: pushing ahead with mouse models for the study of Nagana. II. Immunobiological dysfunctions
- PMID: 20711524
- PMCID: PMC2919407
- DOI: 10.1371/journal.pntd.0000793
Trypanosoma vivax infections: pushing ahead with mouse models for the study of Nagana. II. Immunobiological dysfunctions
Abstract
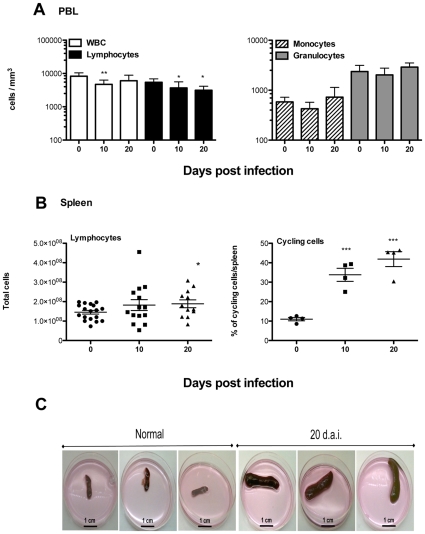
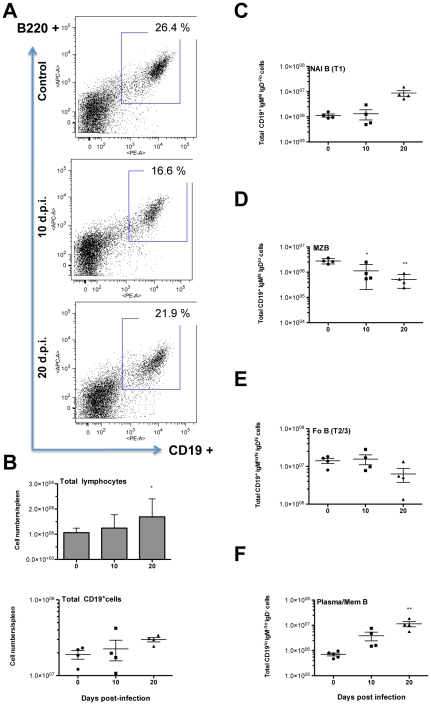
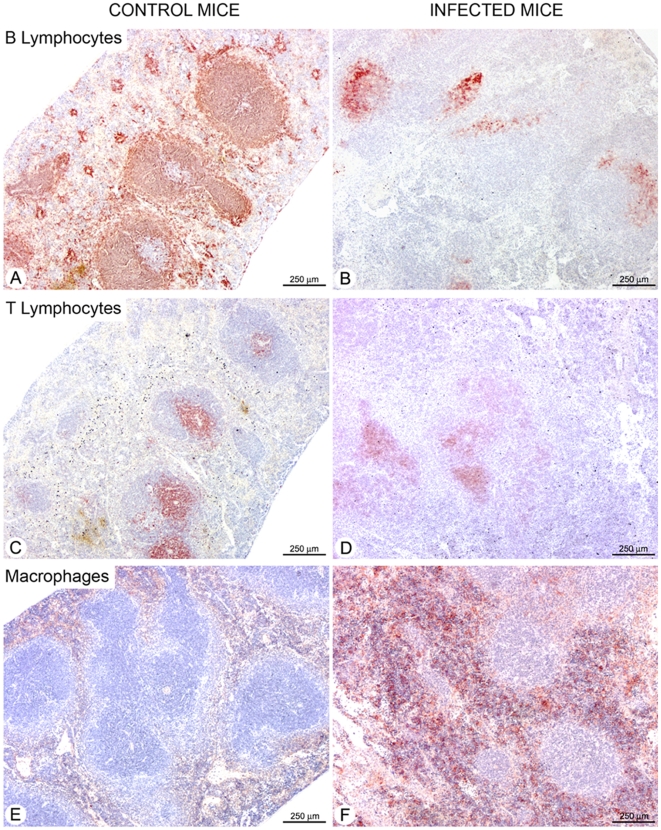
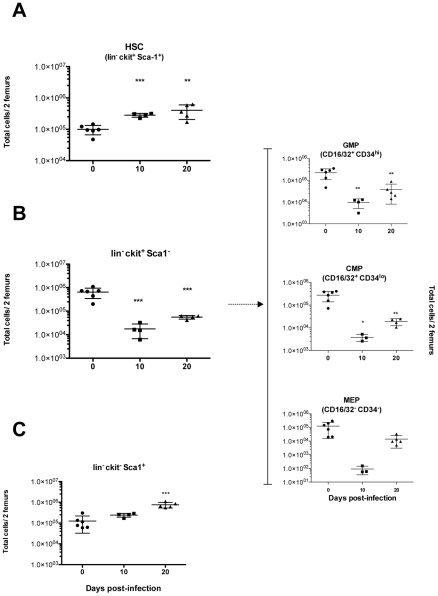
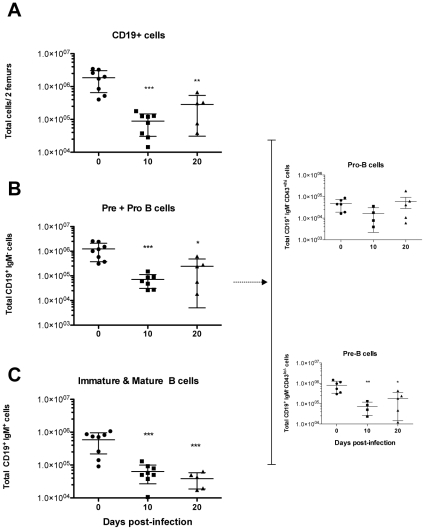
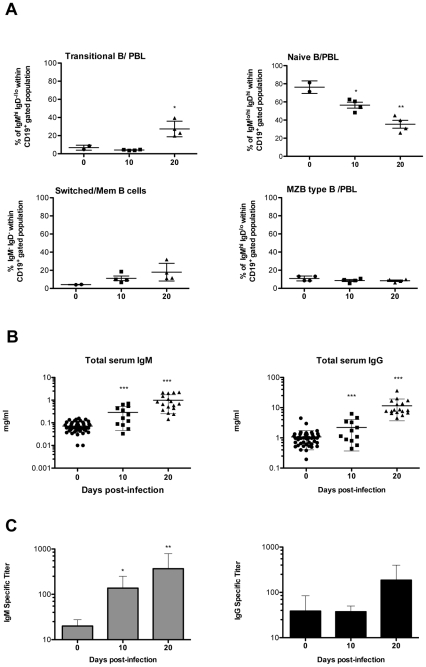
Trypanosoma vivax is the main species involved in trypanosomosis, but very little is known about the immunobiology of the infective process caused by this parasite. Recently we undertook to further characterize the main parasitological, haematological and pathological characteristics of mouse models of T. vivax infection and noted severe anemia and thrombocytopenia coincident with rising parasitemia. To gain more insight into the organism's immunobiology, we studied lymphocyte populations in central (bone marrow) and peripherical (spleen and blood) tissues following mouse infection with T. vivax and showed that the immune system apparatus is affected both quantitatively and qualitatively. More precisely, after an initial increase that primarily involves CD4(+) T cells and macrophages, the number of splenic B cells decreases in a step-wise manner. Our results show that while infection triggers the activation and proliferation of Hematopoietic Stem Cells, Granulocyte-Monocyte, Common Myeloid and Megacaryocyte Erythrocyte progenitors decrease in number in the course of the infection. An in-depth analysis of B-cell progenitors also indicated that maturation of pro-B into pre-B precursors seems to be compromised. This interferes with the mature B cell dynamics and renewal in the periphery. Altogether, our results show that T. vivax induces profound immunological alterations in myeloid and lymphoid progenitors which may prevent adequate control of T. vivax trypanosomosis.
Conflict of interest statement
The authors have declared that no competing interests exist.
Figures
Similar articles
-
Trypanosoma vivax infections: pushing ahead with mouse models for the study of Nagana. I. Parasitological, hematological and pathological parameters.PLoS Negl Trop Dis. 2010 Aug 10;4(8):e792. doi: 10.1371/journal.pntd.0000792. PLoS Negl Trop Dis. 2010. PMID: 20706595 Free PMC article.
-
In vitro erythrophagocytosis by cultured macrophages stimulated with extraneous substances and those isolated from the blood, spleen and bone marrow of Boran and N'Dama cattle infected with Trypanosoma congolense and Trypanosoma vivax.Onderstepoort J Vet Res. 2000 Dec;67(4):273-87. Onderstepoort J Vet Res. 2000. PMID: 11206395
-
Non-invasive in vivo study of the Trypanosoma vivax infectious process consolidates the brain commitment in late infections.PLoS Negl Trop Dis. 2013;7(1):e1976. doi: 10.1371/journal.pntd.0001976. Epub 2013 Jan 3. PLoS Negl Trop Dis. 2013. PMID: 23301112 Free PMC article.
-
Host parasite relationships in Trypanosoma (duttonella) vivax with special reference to the influence of antigenic variation.Vet Q. 1982 Jan;4(1):32-5. doi: 10.1080/01652176.1982.9693835. Vet Q. 1982. PMID: 15861585 Review.
-
Alternative versus classical macrophage activation during experimental African trypanosomosis.Int J Parasitol. 2001 May 1;31(5-6):575-87. doi: 10.1016/s0020-7519(01)00170-9. Int J Parasitol. 2001. PMID: 11334945 Review.
Cited by
-
Trypanosoma brucei Co-opts NK Cells to Kill Splenic B2 B Cells.PLoS Pathog. 2016 Jul 12;12(7):e1005733. doi: 10.1371/journal.ppat.1005733. eCollection 2016 Jul. PLoS Pathog. 2016. PMID: 27403737 Free PMC article.
-
Trypanosoma vivax infection in sheep: Different patterns of virulence and pathogenicity associated with differentially expressed proteomes.Vet Parasitol X. 2019 Jun 8;2:100014. doi: 10.1016/j.vpoa.2019.100014. eCollection 2019 Nov. Vet Parasitol X. 2019. PMID: 32904712 Free PMC article.
-
Genetic engineering of Trypanosoma (Dutonella) vivax and in vitro differentiation under axenic conditions.PLoS Negl Trop Dis. 2011 Dec;5(12):e1461. doi: 10.1371/journal.pntd.0001461. Epub 2011 Dec 27. PLoS Negl Trop Dis. 2011. PMID: 22216367 Free PMC article.
-
Salivarian Trypanosomosis: A Review of Parasites Involved, Their Global Distribution and Their Interaction With the Innate and Adaptive Mammalian Host Immune System.Front Immunol. 2018 Oct 2;9:2253. doi: 10.3389/fimmu.2018.02253. eCollection 2018. Front Immunol. 2018. PMID: 30333827 Free PMC article. Review.
-
Gambiense human african trypanosomiasis and immunological memory: effect on phenotypic lymphocyte profiles and humoral immunity.PLoS Pathog. 2014 Mar 6;10(3):e1003947. doi: 10.1371/journal.ppat.1003947. eCollection 2014 Mar. PLoS Pathog. 2014. PMID: 24603894 Free PMC article.
References
-
- Boid R, Mleche WC. Isoenzyme analysis of stocks of trypanosomes isolated from cattle in Indonesia. Res Vet Sci. 1985;39:388–389. - PubMed
-
- Gardiner PR, Wilson AJ. Trypanosoma (Duttonefla) vivax. Parasitol Today. 1987;3:49–52. - PubMed
-
- Osorio AL, Madruga CR, Desquesnes M, Soares CO, Ribeiro LR, et al. Trypanosoma (Duttonella) vivax: its biology, epidemiology, pathogenesis, and introduction in the New World—a review. Mem Inst Oswaldo Cruz. 2008;103:1–13. - PubMed
-
- Joshua RA. Effect of strains of mice and challenge dose on the infectivity and virulence of Trypanosoma vivax. Vet Parasitol. 1986;19:39–45. - PubMed
Publication types
MeSH terms
LinkOut - more resources
Full Text Sources
Research Materials
