

Multidimensional glycan arrays for enhanced antibody profiling
- PMID: 20711537
- PMCID: PMC3462433
- DOI: 10.1039/c002259d
Multidimensional glycan arrays for enhanced antibody profiling
Abstract
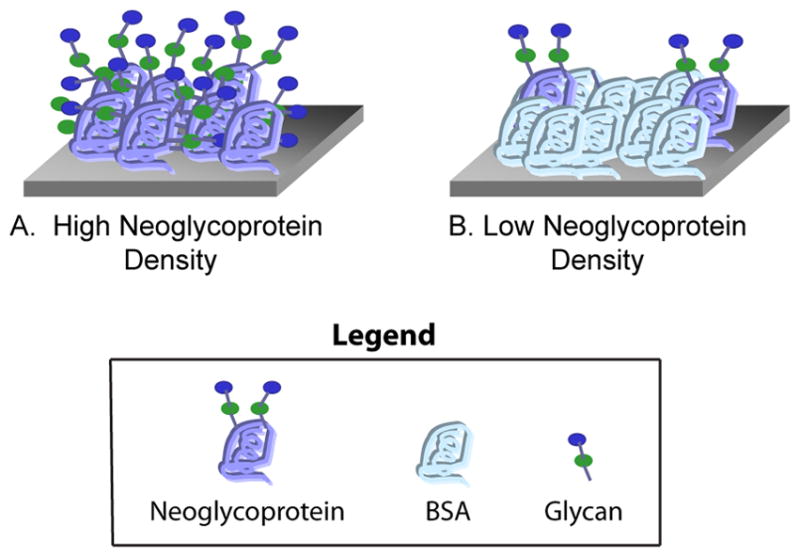
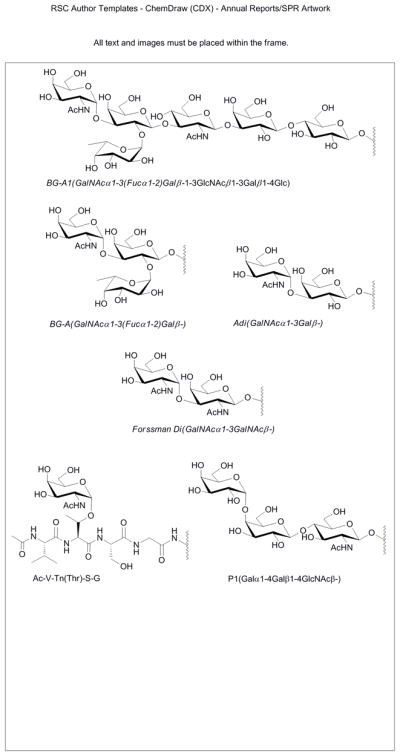
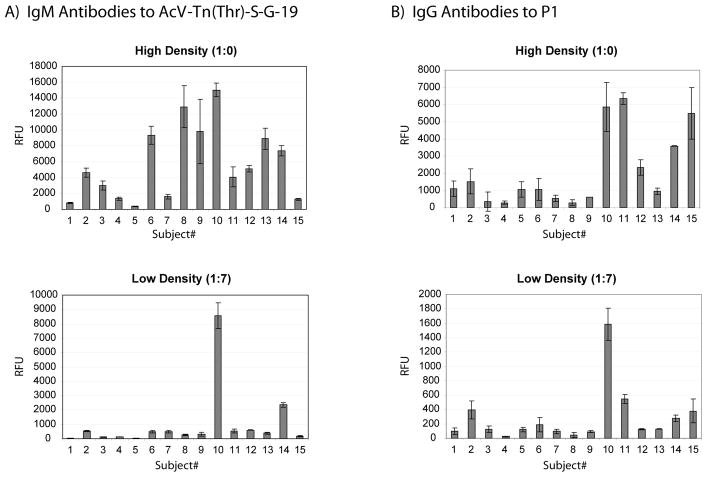
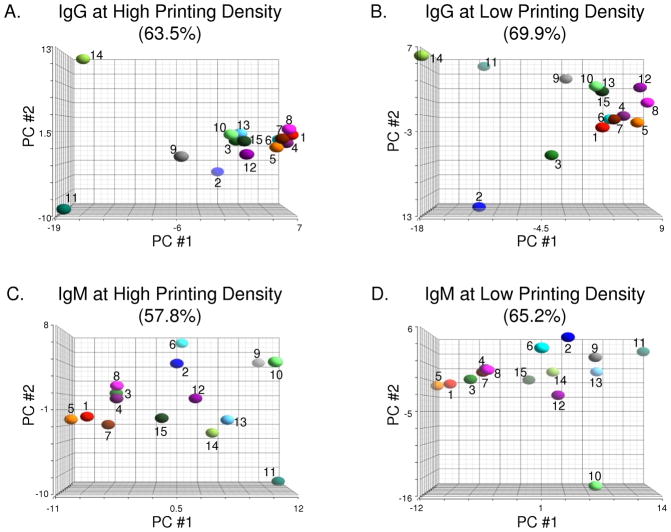
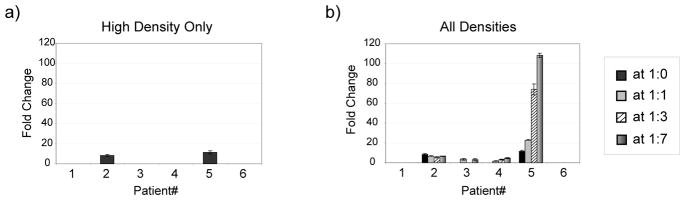
Carbohydrate-binding antibodies play a critical role in basic and clinical research. Monoclonal antibodies that bind glycans are used to measure carbohydrate expression, and serum antibodies to glycans can be important elements of the immune response to pathogens and vaccines. Carbohydrate antigen arrays, or glycan arrays, have emerged as powerful tools for the high-throughput analysis of carbohydrate-protein interactions. Our group has focused on the development and application of neoglycoprotein arrays, a unique array format wherein carbohydrates are covalently attached to a carrier protein prior to immobilization on the surface. The neoglycoprotein format permits variations of glycan structure, glycan density, and neoglycoprotein density on a single array. The focus of this study was on the effects of neoglycoprotein density on antibody binding. First, we evaluated binding of five monoclonal antibodies (81FR2.2, HE-195, HE-193, B480, and Z2A) to the blood group A antigen and found that neoglycoprotein density had a substantial effect on recognition. Next, we profiled serum antibodies in 15 healthy individuals and showed that inclusion of multiple neoglycoprotein densities helps distinguish different subpopulations of antibodies. Finally, we evaluated immune responses induced by a prostate cancer vaccine and showed that variations in neoglycoprotein density enable one to detect antibody responses that could not be detected otherwise. Neoglycoprotein density is a useful element of diversity for evaluating antibody recognition and, when combined with variations in glycan structure and glycan density, provides multidimensional glycan arrays with enhanced performance for monoclonal antibody development, biomarker discovery, and vaccine optimization.
Figures
Similar articles
-
The Glycan Array Platform as a Tool to Identify Carbohydrate Antigens.Methods Mol Biol. 2015;1331:27-40. doi: 10.1007/978-1-4939-2874-3_3. Methods Mol Biol. 2015. PMID: 26169733 Free PMC article.
-
Glycan array analysis of the antigen repertoire targeted by tumor-binding antibodies.Bioorg Med Chem Lett. 2012 Nov 15;22(22):6839-43. doi: 10.1016/j.bmcl.2012.09.055. Epub 2012 Sep 24. Bioorg Med Chem Lett. 2012. PMID: 23063402 Free PMC article.
-
Serum antibody screening by surface plasmon resonance using a natural glycan microarray.Glycoconj J. 2008 Jan;25(1):75-84. doi: 10.1007/s10719-007-9100-x. Epub 2008 Jan 12. Glycoconj J. 2008. PMID: 18193481
-
Glycan microarrays: powerful tools for biomarker discovery.Cancer Biomark. 2014 Jan 1;14(1):29-41. doi: 10.3233/CBM-130383. Cancer Biomark. 2014. PMID: 24643040 Review.
-
Multi-dimensional glycan microarrays with glyco-macroligands.Glycoconj J. 2015 Oct;32(7):483-95. doi: 10.1007/s10719-015-9580-z. Epub 2015 May 10. Glycoconj J. 2015. PMID: 25957565 Review.
Cited by
-
Carbohydrate microarrays.Chem Soc Rev. 2013 May 21;42(10):4310-26. doi: 10.1039/c2cs35401b. Epub 2012 Nov 28. Chem Soc Rev. 2013. PMID: 23192235 Free PMC article. Review.
-
Immunologic mapping of glycomes: implications for cancer diagnosis and therapy.Front Biosci (Schol Ed). 2011 Jun 1;3(4):1520-32. doi: 10.2741/242. Front Biosci (Schol Ed). 2011. PMID: 21622287 Free PMC article. Review.
-
High-throughput profiling of anti-glycan humoral responses to SIV vaccination and challenge.PLoS One. 2013 Sep 23;8(9):e75302. doi: 10.1371/journal.pone.0075302. eCollection 2013. PLoS One. 2013. PMID: 24086502 Free PMC article.
-
Targeting tumor-associated carbohydrate antigens: a phase I study of a carbohydrate mimetic-peptide vaccine in stage IV breast cancer subjects.Oncotarget. 2017 Oct 23;8(58):99161-99178. doi: 10.18632/oncotarget.21959. eCollection 2017 Nov 17. Oncotarget. 2017. PMID: 29228761 Free PMC article.
-
Synthetic glycoscapes: addressing the structural and functional complexity of the glycocalyx.Interface Focus. 2019 Apr 6;9(2):20180080. doi: 10.1098/rsfs.2018.0080. Epub 2019 Feb 15. Interface Focus. 2019. PMID: 30842878 Free PMC article. Review.
References
Publication types
MeSH terms
Substances
Grants and funding
LinkOut - more resources
Full Text Sources
Other Literature Sources