

Evidence that His349 acts as a pH-inducible switch to accelerate receptor-mediated iron release from the C-lobe of human transferrin
- PMID: 20711621
- PMCID: PMC4505821
- DOI: 10.1007/s00775-010-0694-2
Evidence that His349 acts as a pH-inducible switch to accelerate receptor-mediated iron release from the C-lobe of human transferrin
Abstract
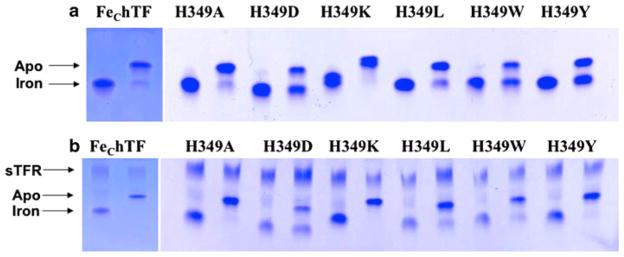
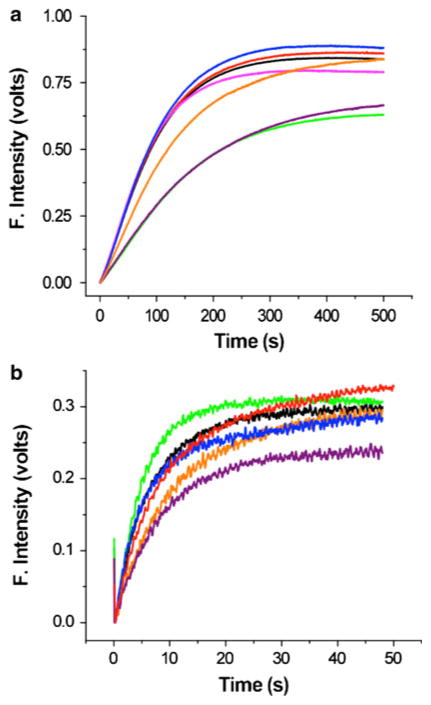
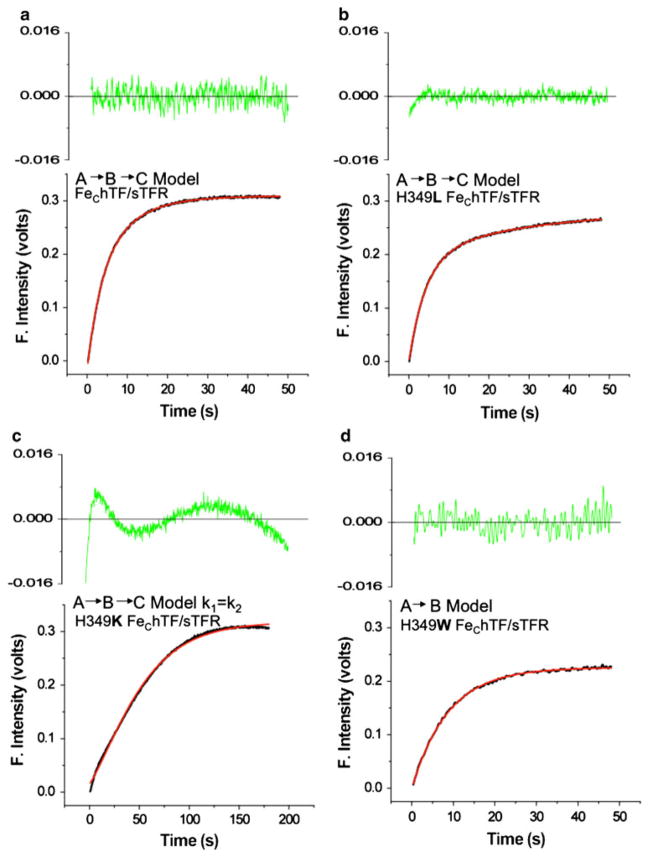
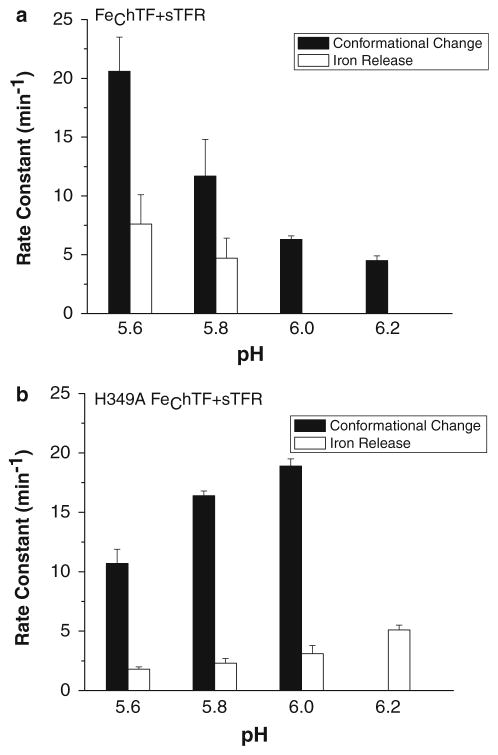
His349 in human transferrin (hTF) is a residue critical to transferrin receptor (TFR)-stimulated iron release from the C-lobe. To evaluate the importance of His349 on the TFR interaction, it was replaced by alanine, aspartate, lysine, leucine, tryptophan, and tyrosine in a monoferric C-lobe hTF construct (Fe(C)hTF). Using a stopped-flow spectrofluorimeter, we determined rate processes assigned to iron release and conformational events (in the presence and in the absence of the TFR). Significantly, all mutant/TFR complexes feature dampened iron release rates. The critical contribution of His349 is most convincingly revealed by analysis of the kinetics as a function of pH (5.6-6.2). The Fe(C)hTF/TFR complex titrates with a pK(a) of approximately 5.9. By contrast, the H349A mutant/TFR complex releases iron at higher pH with a profile that is almost the inverse of that of the control complex. At the putative endosomal pH of 5.6 (in the presence of salt and chelator), iron is released from the H349W mutant/TFR and H349Y mutant/TFR complexes with a single rate constant similar to the iron release rate constant for the control; this suggests that these substitutions bypass the required pH-induced conformational change allowing the C-lobe to directly interact with the TFR to release iron. The H349K mutant proves that although the positive charge is crucial to complete iron release, the geometry at this position is also critical. The H349D mutant shows that a negative charge precludes complete iron release at pH 5.6 both in the presence and in the absence of the TFR. Thus, histidine uniquely drives the pH-induced conformational change in the C-lobe required for TFR interaction, which in turn promotes iron release.
Figures
Similar articles
-
How the binding of human transferrin primes the transferrin receptor potentiating iron release at endosomal pH.Proc Natl Acad Sci U S A. 2011 Aug 9;108(32):13089-94. doi: 10.1073/pnas.1105786108. Epub 2011 Jul 25. Proc Natl Acad Sci U S A. 2011. PMID: 21788477 Free PMC article.
-
Kinetics of iron release from transferrin bound to the transferrin receptor at endosomal pH.Biochim Biophys Acta. 2012 Mar;1820(3):326-33. doi: 10.1016/j.bbagen.2011.06.003. Epub 2011 Jun 15. Biochim Biophys Acta. 2012. PMID: 21699959 Free PMC article. Review.
-
The unique kinetics of iron release from transferrin: the role of receptor, lobe-lobe interactions, and salt at endosomal pH.J Mol Biol. 2010 Feb 12;396(1):130-40. doi: 10.1016/j.jmb.2009.11.023. Epub 2009 Nov 13. J Mol Biol. 2010. PMID: 19917294 Free PMC article.
-
Structure-based mutagenesis reveals critical residues in the transferrin receptor participating in the mechanism of pH-induced release of iron from human serum transferrin.Biochemistry. 2012 Mar 13;51(10):2113-21. doi: 10.1021/bi3001038. Epub 2012 Mar 1. Biochemistry. 2012. PMID: 22356162 Free PMC article.
-
Transferrin-mediated cellular iron delivery.Curr Top Membr. 2012;69:3-35. doi: 10.1016/B978-0-12-394390-3.00001-X. Curr Top Membr. 2012. PMID: 23046645 Free PMC article. Review.
Cited by
-
The structural basis of transferrin sequestration by transferrin-binding protein B.Nat Struct Mol Biol. 2012 Feb 19;19(3):358-60. doi: 10.1038/nsmb.2251. Nat Struct Mol Biol. 2012. PMID: 22343719 Free PMC article.
-
How the binding of human transferrin primes the transferrin receptor potentiating iron release at endosomal pH.Proc Natl Acad Sci U S A. 2011 Aug 9;108(32):13089-94. doi: 10.1073/pnas.1105786108. Epub 2011 Jul 25. Proc Natl Acad Sci U S A. 2011. PMID: 21788477 Free PMC article.
-
Kinetics of iron release from transferrin bound to the transferrin receptor at endosomal pH.Biochim Biophys Acta. 2012 Mar;1820(3):326-33. doi: 10.1016/j.bbagen.2011.06.003. Epub 2011 Jun 15. Biochim Biophys Acta. 2012. PMID: 21699959 Free PMC article. Review.
-
Electrostatic effects control the stability and iron release kinetics of ovotransferrin.J Biol Inorg Chem. 2014 Aug;19(6):1009-24. doi: 10.1007/s00775-014-1145-2. Epub 2014 May 22. J Biol Inorg Chem. 2014. PMID: 24850130
-
Ionic residues of human serum transferrin affect binding to the transferrin receptor and iron release.Biochemistry. 2012 Jan 17;51(2):686-94. doi: 10.1021/bi201661g. Epub 2012 Jan 6. Biochemistry. 2012. PMID: 22191507 Free PMC article.
References
Publication types
MeSH terms
Substances
Grants and funding
LinkOut - more resources
Full Text Sources
Medical
