

The dominant Anopheles vectors of human malaria in the Americas: occurrence data, distribution maps and bionomic précis
- PMID: 20712879
- PMCID: PMC2936890
- DOI: 10.1186/1756-3305-3-72
The dominant Anopheles vectors of human malaria in the Americas: occurrence data, distribution maps and bionomic précis
Erratum in
- Parasit Vectors. 2011;4:210
Abstract
Background: An increasing knowledge of the global risk of malaria shows that the nations of the Americas have the lowest levels of Plasmodium falciparum and P. vivax endemicity worldwide, sustained, in part, by substantive integrated vector control. To help maintain and better target these efforts, knowledge of the contemporary distribution of each of the dominant vector species (DVS) of human malaria is needed, alongside a comprehensive understanding of the ecology and behaviour of each species.
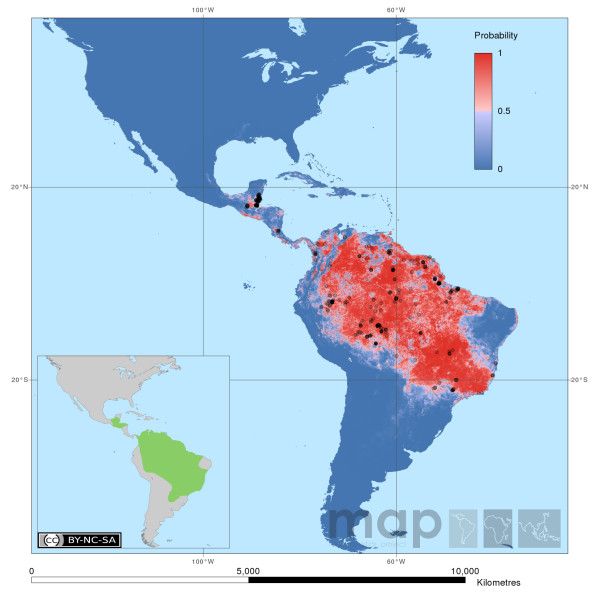
Results: A database of contemporary occurrence data for 41 of the DVS of human malaria was compiled from intensive searches of the formal and informal literature. The results for the nine DVS of the Americas are described in detail here. Nearly 6000 occurrence records were gathered from 25 countries in the region and were complemented by a synthesis of published expert opinion range maps, refined further by a technical advisory group of medical entomologists. A suite of environmental and climate variables of suspected relevance to anopheline ecology were also compiled from open access sources. These three sets of data were then combined to produce predictive species range maps using the Boosted Regression Tree method. The predicted geographic extent for each of the following species (or species complex*) are provided: Anopheles (Nyssorhynchus) albimanus Wiedemann, 1820, An. (Nys.) albitarsis*, An. (Nys.) aquasalis Curry, 1932, An. (Nys.) darlingi Root, 1926, An. (Anopheles) freeborni Aitken, 1939, An. (Nys.) marajoara Galvão & Damasceno, 1942, An. (Nys.) nuneztovari*, An. (Ano.) pseudopunctipennis* and An. (Ano.) quadrimaculatus Say, 1824. A bionomics review summarising ecology and behaviour relevant to the control of each of these species was also compiled.
Conclusions: The distribution maps and bionomics review should both be considered as a starting point in an ongoing process of (i) describing the distributions of these DVS (since the opportunistic sample of occurrence data assembled can be substantially improved) and (ii) documenting their contemporary bionomics (since intervention and control pressures can act to modify behavioural traits). This is the first in a series of three articles describing the distribution of the 41 global DVS worldwide. The remaining two publications will describe those vectors found in (i) Africa, Europe and the Middle East and (ii) in Asia. All geographic distribution maps are being made available in the public domain according to the open access principles of the Malaria Atlas Project.
Figures
References
-
- Guerra CA, Howes RE, Patil AP, Gething PW, Van Boeckel TP, Temperley WH, Kabaria CW, Tatem AJ, Manh BH, Elyazar IRF, Baird KJ, Snow RW, Hay SI. The international limits and population at risk of Plasmodium vivax transmission in 2009. PLoS Negl Trop Dis. 2010;4:e774. doi: 10.1371/journal.pntd.0000774. - DOI - PMC - PubMed
Grants and funding
LinkOut - more resources
Full Text Sources
Molecular Biology Databases
