. 2010 Aug 16;42(1):35.
doi: 10.1186/1297-9686-42-35.

Dynamics of long-term genomic selection

Affiliations

Dynamics of long-term genomic selection

Jean-Luc Jannink. Genet Sel Evol. .

Abstract

Background: Simulation and empirical studies of genomic selection (GS) show accuracies sufficient to generate rapid gains in early selection cycles. Beyond those cycles, allele frequency changes, recombination, and inbreeding make analytical prediction of gain impossible. The impacts of GS on long-term gain should be studied prior to its implementation.

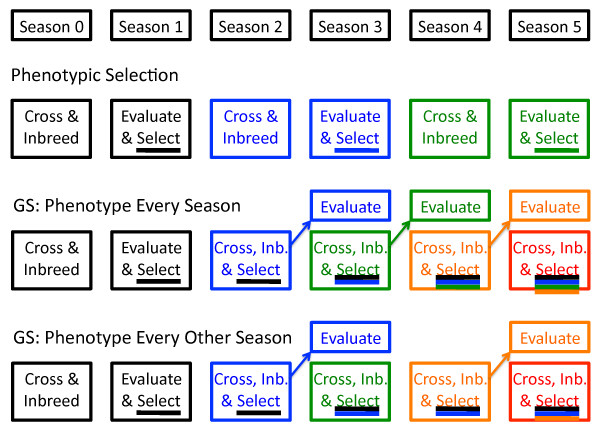
Methods: A simulation case-study of this issue was done for barley, an inbred crop. On the basis of marker data on 192 breeding lines from an elite six-row spring barley program, stochastic simulation was used to explore the effects of large or small initial training populations with heritabilities of 0.2 or 0.5, applying GS before or after phenotyping, and applying additional weight on low-frequency favorable marker alleles. Genomic predictions were from ridge regression or a Bayesian analysis.

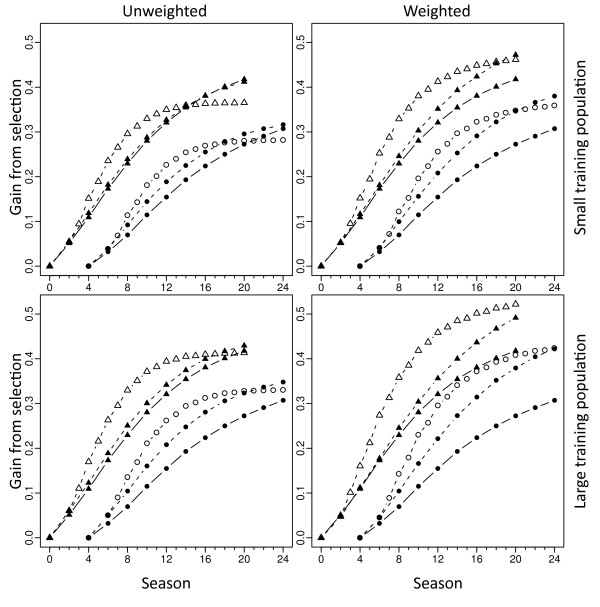
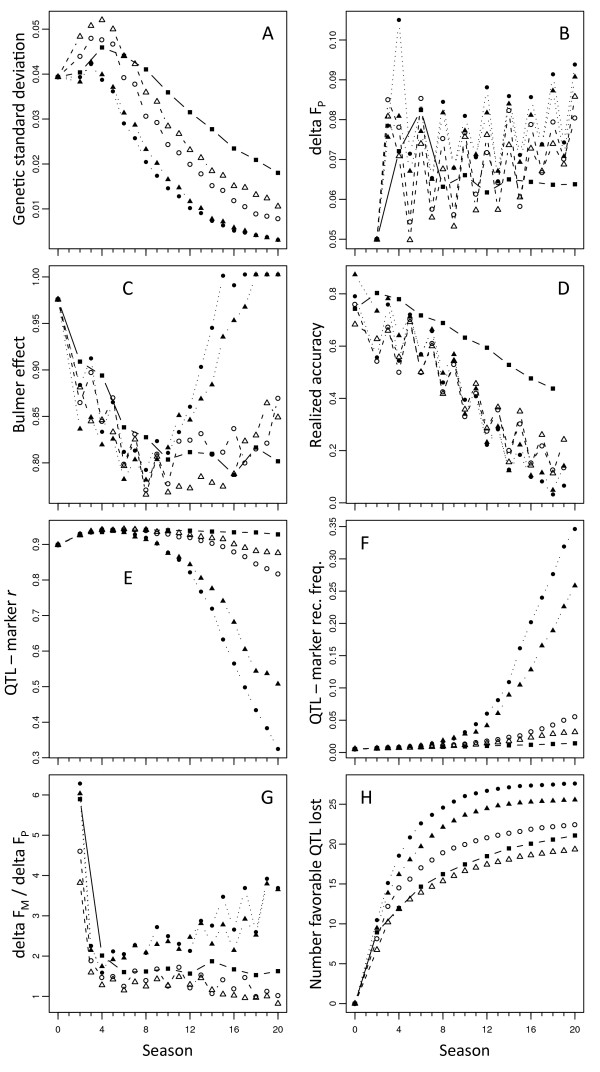
Results: Assuming that applying GS prior to phenotyping shortened breeding cycle time by 50%, this practice strongly increased early selection gains but also caused the loss of many favorable QTL alleles, leading to loss of genetic variance, loss of GS accuracy, and a low selection plateau. Placing additional weight on low-frequency favorable marker alleles, however, allowed GS to increase their frequency earlier on, causing an initial increase in genetic variance. This dynamic led to higher long-term gain while mitigating losses in short-term gain. Weighted GS also increased the maintenance of marker polymorphism, ensuring that QTL-marker linkage disequilibrium was higher than in unweighted GS.

Conclusions: Losing favorable alleles that are in weak linkage disequilibrium with markers is perhaps inevitable when using GS. Placing additional weight on low-frequency favorable alleles, however, may reduce the rate of loss of such alleles to below that of phenotypic selection. Applying such weights at the beginning of GS implementation is important.


Figures

Figure 1
Figure 1
Phenotypic and genomic selection breeding schemes. Under phenotypic selection, one season is used for crossing and inbreeding and the next for evaluation and selection; under GS, selection can be performed prior to evaluation so that selection occurs every season rather than every other season; for "every season phenotyping," the evaluation is assumed to represent the target environment in any season; for "every other season phenotyping," only odd-numbered seasons represent the target environment and even-numbered seasons are greenhouse or off-season nurseries; for all methods, the black cycle (C0) is phenotyped; for GS, this cycle contributes to the training population (TP), as indicated by the colored line under the word "Select" in Season 1; in Season 2, candidates of the blue cycle (C1) are produced, and selection is possible under GS, but using the same TP as for Season 1 (insufficient time for new phenotyping has elapsed); in Season 3, candidates of the green cycle (C2) are produced, evaluation of C1 candidates occurs and can contribute to the TP used to select C2 candidates; similar events occur in Season 4 except that for every other season phenotyping, evaluations are not performed because they would not be representative of the target environment
Figure 2
Figure 2
Gain from phenotypic and genomic selection. Phenotypic selection (PS, closed symbols, continuous lines), genomic selection with phenotyping prior to selection (GPS, closed symbols, dashed lines), and genomic selection (GS, open symbols, dashed lines), using ridge regression to estimate genomic breeding values. Weighted and unweighted methods were used for GS and GPS, on the right- and left-hand graphs, respectively; small and large training populations were of 200 and 1000 individuals, on the upper and lower graphs, respectively; triangles: h2 = 0.5; Circles: h2 = 0.2; to avoid cluttered graphs, simulations with h2 = 0.2 were offset to the right by four seasons; note that PS curves are identical across the four graphs; maximum standard errors observed were less than half the height of plot symbols so no error bars are given
Figure 3
Figure 3
Variables affecting long-term response to genomic selection. Simulations at heritability of 0.5 using ridge regression to estimate breeding values and model updating every other season. Squares and continuous lines: phenotypic selection; circles vs triangles: small vs. large training population; closed vs open: unweighted vs. weighted GS; seasons correspond to the scheme given in Figure 1; A. genetic standard deviation among selection candidates in each cycle; B. rate of inbreeding calculated on the basis of pedigree, ΔFP; C. Bulmer effect, given by the ratio between observed genotypic standard deviation and that expected under linkage equilibrium; D. realized accuracy of selection; E. mean absolute correlation between QTL and markers in highest LD with them; F. mean recombination frequency between QTL and markers closest to them; G. ratio between rate of inbreeding calculated on the basis of markers (ΔFM) to that on the basis of pedigree; H. number of favorable QTL alleles lost from the selection population

References

    1. Meuwissen THE, Hayes BJ, Goddard ME. Prediction of total genetic value using genome-wide dense marker maps. Genetics. 2001;157:1819–1829. - PMC - PubMed
    1. Bernardo R, Yu J. Prospects for genome-wide selection for quantitative traits in maize. Crop Sci. 2007;47:1082–1090. doi: 10.2135/cropsci2006.11.0690. - DOI
    1. VanRaden PM, Van Tassell CP, Wiggans GR, Sonstegard TS, Schnabel RD, Taylor JF, Schenkel FS. Invited Review: Reliability of genomic predictions for North American Holstein bulls. J Dairy Sci. 2009;92:16–24. doi: 10.3168/jds.2008-1514. - DOI - PubMed
    1. Lorenzana R, Bernardo R. Accuracy of genotypic value predictions for marker-based selection in biparental plant populations. Theor Appl Genet. 2009;120:151–161. doi: 10.1007/s00122-009-1166-3. - DOI - PubMed
    1. Jannink J-L, Lorenz AJ, Iwata H. Genomic selection in plant breeding: from theory to practice. Brief Funct Genomics. 2010;9:166–177. - PubMed

Publication types

LinkOut - more resources