. 2010 Aug 9;99(4):997-1006.
doi: 10.1016/j.bpj.2010.04.069.

Mitochondrial free [Ca2+] increases during ATP/ADP antiport and ADP phosphorylation: exploration of mechanisms

Affiliations

Mitochondrial free [Ca2+] increases during ATP/ADP antiport and ADP phosphorylation: exploration of mechanisms

Johan Haumann et al. Biophys J. .

Erratum in

  • Biophys J. 2010 Dec 15;99(12):4078

Abstract

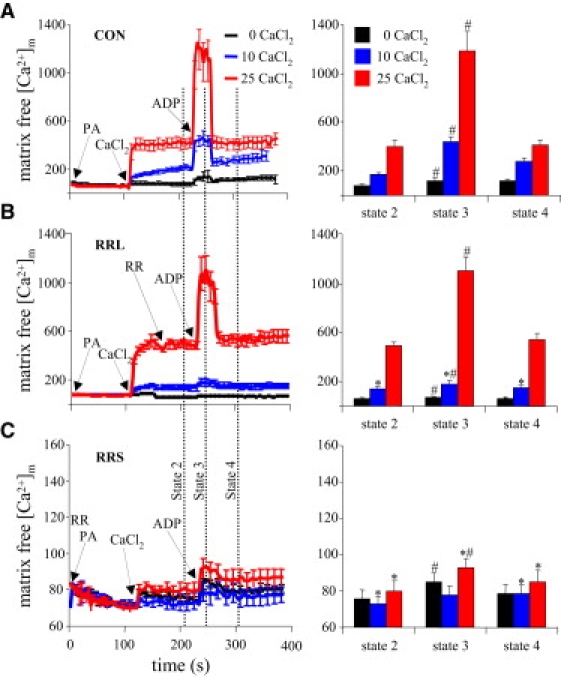
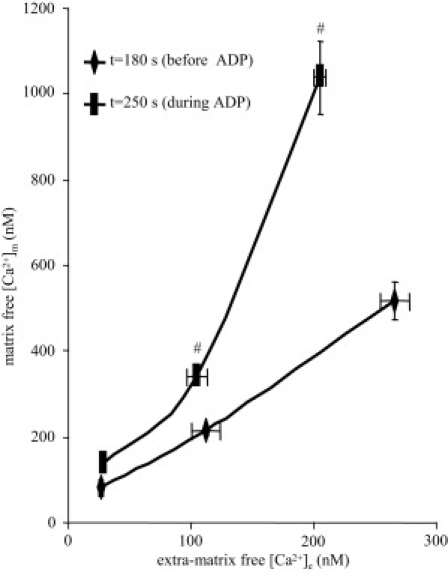
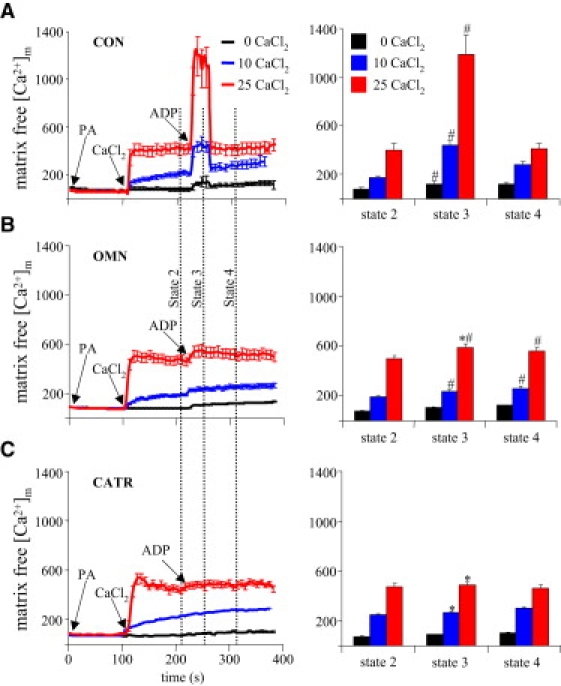
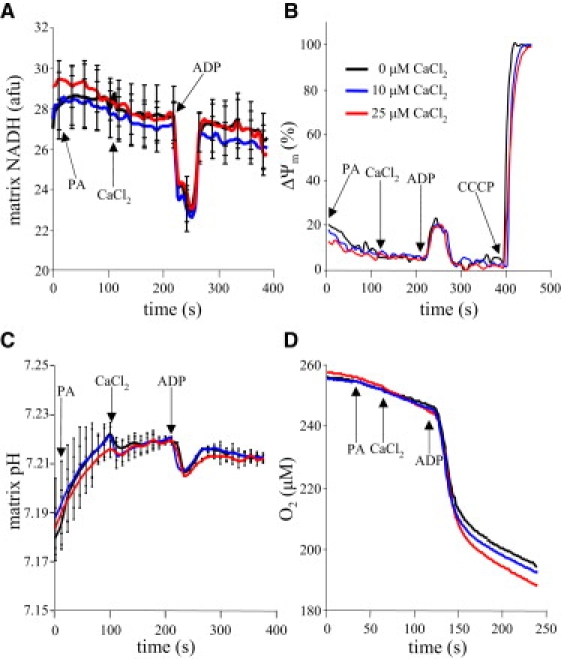
ADP influx and ADP phosphorylation may alter mitochondrial free [Ca2+] ([Ca2+](m)) and consequently mitochondrial bioenergetics by several postulated mechanisms. We tested how [Ca2+](m) is affected by H2PO4(-) (P(i)), Mg2+, calcium uniporter activity, matrix volume changes, and the bioenergetic state. We measured [Ca2+](m), membrane potential, redox state, matrix volume, pH(m), and O2 consumption in guinea pig heart mitochondria with or without ruthenium red, carboxyatractyloside, or oligomycin, and at several levels of Mg2+ and P(i). Energized mitochondria showed a dose-dependent increase in [Ca2+](m) after adding CaCl2 equivalent to 20, 114, and 485 nM extramatrix free [Ca2+] ([Ca2+](e)); this uptake was attenuated at higher buffer Mg2+. Adding ADP transiently increased [Ca2+](m) up to twofold. The ADP effect on increasing [Ca2+](m) could be partially attributed to matrix contraction, but was little affected by ruthenium red or changes in Mg2+ or P(i). Oligomycin largely reduced the increase in [Ca2+](m) by ADP compared to control, and [Ca2+](m) did not return to baseline. Carboxyatractyloside prevented the ADP-induced [Ca2+](m) increase. Adding CaCl2 had no effect on bioenergetics, except for a small increase in state 2 and state 4 respiration at 485 nM [Ca2+](e). These data suggest that matrix ADP influx and subsequent phosphorylation increase [Ca2+](m) largely due to the interaction of matrix Ca2+ with ATP, ADP, P(i), and cation buffering proteins in the matrix.


Figures

Figure 1
Figure 1
Time line for adding substances to experimental buffer. PA, pyruvic acid; RRS and RRL, ruthenium red at start or later; ADP, adenosine diphosphate; CATR, carboxyatractyloside; OMN, oligomycin; CCCP, carbonylcyanide m-chlorophenylhydrazone.
Figure 2
Figure 2
Extramatrix free [Ca2+] ([Ca2+]e) over time measured using indo-1 (in the presence of 40 μM EGTA). Adding CaCl2 increased [Ca2+]e in a concentration-dependent manner. Adding 25 μM CaCl2 increased [Ca2+]e up to 485 nM, which then slowly declined as Ca2+ was taken up into the matrix. Adding 10 μM CaCl2 increased [Ca2+]e to 114 nM with a lesser and slower subsequent Ca2+ uptake. RR blocked matrix uptake of Ca2+ through the CU so that [Ca2+]e remained constant. ADP caused a small decrease in [Ca2+]e only in the presence of RR.
Figure 3
Figure 3
Effects of ADP and RR on [Ca2+]m over time, measured using indo-1 AM. Dynamic, time-dependent changes (left column) and mean changes (right column) taken at the vertical dotted lines in the left column are displayed. (A) Adding 10 and 25 μM CaCl2 in energized mitochondria (after PA) caused abrupt, graded increases in [Ca2+]m to steady-state values. Adding ADP caused an abrupt but transient rise in [Ca2+]m above the values established with added CaCl2. (B) Adding RR after 25 μM CaCl2 (RRL) did not blunt the rise in [Ca2+]m induced by adding ADP. (C) Adding RR before CaCl2 (RRS) blocked Ca2+ uptake, but the ADP-induced increase in [Ca2+]m remained evident, although it was much smaller (note scale) after adding 25 μM CaCl2. In the right column, for P < 0.05, # indicates state 3 versus states 2 and 4 respiration; indicates RRL and RRS versus the CON group at the same respiration state and CaCl2.
Figure 4
Figure 4
[Ca2+]m as a function of [Ca2+]e. [Ca2+]e and [Ca2+]m were measured at t = 100 s (before added CaCl2), at t =180 s (after added CaCl2), and at t = 250 s (in the presence of ADP). ADP caused a more than additive increase in [Ca2+]m as a function of [Ca2+]e, and the increase was dependent on the existing [Ca2+]m level. Data were taken from Figs. 2 and 3A. For P < 0.05, # indicates state 3 versus states 2 and 4 respiration.
Figure 5
Figure 5
Effects of ADP and altered buffer Pi on [Ca2+]m. (A) Same as Fig. 3A, where [Pi] is 5 mM. (B) In both the 10-mM and 1-mM [Pi] groups, there were no significant differences in response to added CaCl2 or ADP versus the corresponding 5-mM [Pi] group. For P < 0.05, # indicates state 3 versus states 2 and 4 respiration; indicates the HP and LP versus CON groups at the same respiration state and CaCl2. See Fig. 3 legend for additional details.
Figure 6
Figure 6
Effect of ADP on [Ca2+]m during inhibited phosphorylation and blocked ADP/ATP transport. (A) Same as Fig. 3A. (B) Adding ADP after CaCl2 and blocking F1F0-ATPase with OMN caused a significant increase in [Ca2+]m after addition of both 10 and 25 μM CaCl2. (C) Adding ADP after CaCl2 when the ADP/ATP carrier was blocked with CATR inhibited the ADP-induced increase in [Ca2+]m. For P < 0.05, # indicates state 3 versus states 2 and 4 respiration; indicates the OMN and CATR versus CON groups at the same respiration state and CaCl2. See Fig. 3 for additional details.
Figure 7
Figure 7
Effects of adding CaCl2 and ADP on mitochondrial bioenergetics. All data correspond to [Ca2+]m data displayed in Fig. 3A (CON). (A) PA increased NADH as the TCA cycle was activated. Adding CaCl2 did not significantly alter NADH values. (B) ADP transiently oxidized mitochondria (i.e., reduced NADH (A)) as energy contained in ΔΨm was consumed, as shown by the transiently lowered ΔΨm. (C) PA induced a mild alkalinization; adding CaCl2 did not further alter the matrix pH. ADP transiently reduced matrix pH as matrix proton influx temporarily exceeded proton pumping. (D) O2 consumption (respiration) increased on addition of PA, and more so on addition of 25 μM CaCl2. Adding ADP markedly enhanced O2 consumption, but adding CaCl2 did not produce any additional effect on respiration. See Table 1 for summary data and statistics on respiration.

Similar articles

Cited by

References

    1. Brandes R., Bers D.M. Intracellular Ca2+ increases the mitochondrial NADH concentration during elevated work in intact cardiac muscle. Circ. Res. 1997;80:82–87. - PubMed
    1. Brandes R., Bers D.M. Simultaneous measurements of mitochondrial NADH and Ca2+ during increased work in intact rat heart trabeculae. Biophys. J. 2002;83:587–604. - PMC - PubMed
    1. McCormack J.G., Halestrap A.P., Denton R.M. Role of calcium ions in regulation of mammalian intramitochondrial metabolism. Physiol. Rev. 1990;70:391–425. - PubMed
    1. Nguyen M.H., Dudycha S.J., Jafri M.S. Effect of Ca2+ on cardiac mitochondrial energy production is modulated by Na+ and H+ dynamics. Am. J. Physiol. Cell Physiol. 2007;292:C2004–C2020. - PubMed
    1. Rossi C.S., Lehninger A.L. Stoichiometry of respiratory stimulation, accumulation of Ca++ and phosphate, and oxidative phosphorylation in rat liver mitochondria. J. Biol. Chem. 1964;239:3971–3980. - PubMed

Publication types

MeSH terms