

doi: 10.1016/j.bpj.2010.06.025.
Actin filament length tunes elasticity of flexibly cross-linked actin networks
Affiliations
- PMID: 20712992
- PMCID: PMC2920742
- DOI: 10.1016/j.bpj.2010.06.025
Item in Clipboard
Actin filament length tunes elasticity of flexibly cross-linked actin networks
Biophys J.
.
Abstract
Networks of the cytoskeletal biopolymer actin cross-linked by the compliant protein filamin form soft gels that stiffen dramatically under shear stress. We demonstrate that the elasticity of these networks shows a strong dependence on the mean length of the actin polymers, unlike networks with small, rigid cross-links. This behavior is in agreement with a model of rigid filaments connected by multiple flexible linkers.
2010 Biophysical Society. Published by Elsevier Inc. All rights reserved.
Figures
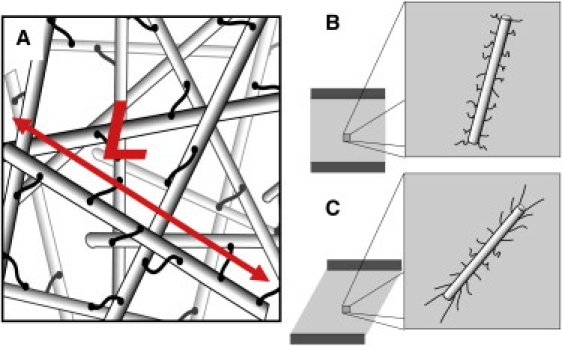
(A) Schematic of network of stiff polymers of mean length L connected by flexible cross-links. (B and C) Schematic of stiff polymer and attached cross-links in a network before (B) and after (C) shear.
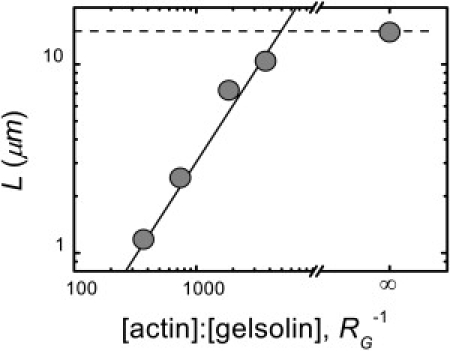
Mean F-actin length L as a function of the molar ratio of actin/gelsolin, RG−1. L decreases from its unregulated value (dashed line) as gelsolin is added. (Solid line) Linear scaling.
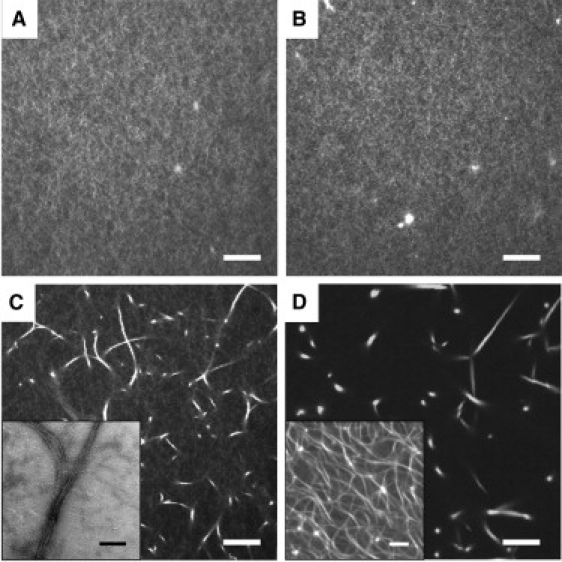
Microstructure of filamin-gelsolin-F-actin networks. (A and B) For RF ≲ 0.01, networks are a homogeneous mesh of F-actin. (C and D) Large bundles are present at high RF. (A) Confocal image, RF = 0.002, RG = 0 (L = 15 μm). (B) Confocal image, RF = 0.01, RG = 1:370 (L = 1 μm). (C) Confocal image, RF = 0.01, RG = 0. (Inset) TEM image. (D) Confocal image, RF = 0.04, RG = 1:370. (Inset) Confocal image at lower magnification to show network connectivity. Scale bars are 10 μm for confocal images and 0.5 μm for TEM image.
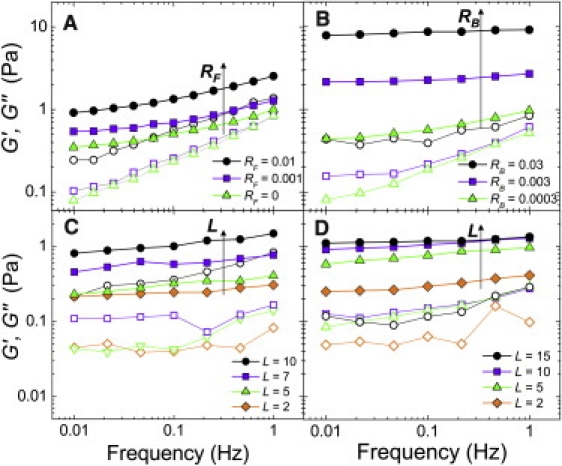
Linear viscoelasticity of cross-linked F-actin networks. Elastic moduli G′ (solid) and viscous moduli G″ (open). Filamin cross-linked networks are soft, viscoelastic solids that become stiffer with increasing RF or L: (A) L = 15 μm with various RF and (C) RF = 0.01 with various L (in μm). Rigidly cross-linked networks become stiffer with increasing L and significantly stiffer and more solidlike with increasing RB: (B) L = 15 μm with various RB, and (D) RB = 0.01 with various L.
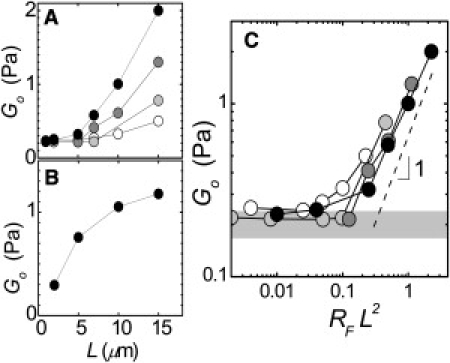
Dependence on L of the linear elastic modulus measured at a frequency of 0.1 Hz, Go. (A) For filamin networks Go increases stronger than linearly with L. RF = 0.001 (open), 0.002 (light shaded), 0.005 (medium shaded), and 0.01 (solid). (B) Rigidly cross-linked networks show qualitatively different behavior. RB = 0.01. (C) Go for networks cross-linked with filamin at different RF collapse onto a single curve when plotted versus RFL2 with nearly linear scaling above RFL2 = 0.1. Shaded bar represents the range of moduli measured for F-actin solutions with 2 < L < 7 μm.
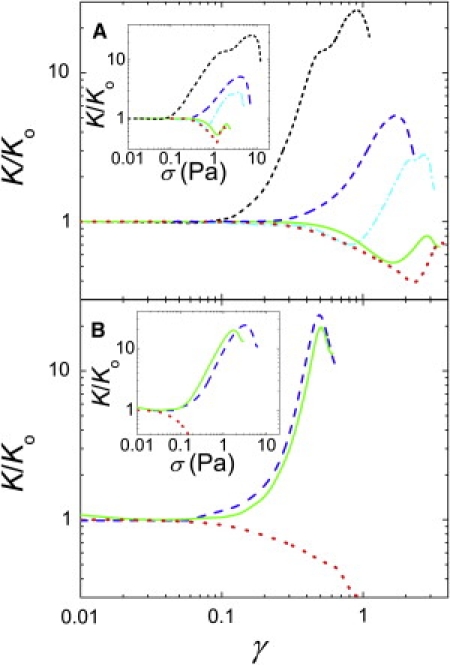
Nonlinear stiffening in strain ramps with a rate of 0.1/s. The derivative of the stress-strain curve, K, normalized by its initial value, Ko, as a function of strain. (A) Filamin with RF = 0.01 and L = 15 (short dash), 10 (long dash), 7 (dash-dot), 5 (solid), and 2 (dot) μm. For the network with L = 15 μm, K/Ko = 1 at small strains before beginning to stiffen above γc = 0.06. Networks with shorter filaments initially display weakening behavior, where K/Ko decreases below 1, due to their lower network connectivity, but stiffen at higher strains where the slope of the curve becomes positive. The value γc increases with decreasing L. (B) Rigid cross-links with RB = 0.01 and L = 10 (dash), 5 (solid), and 2 (dot) μm. Networks with long filaments display stiffening behavior that is independent of L, while networks with short filaments display weakening behavior. (Insets) Same data plotted versus stress.
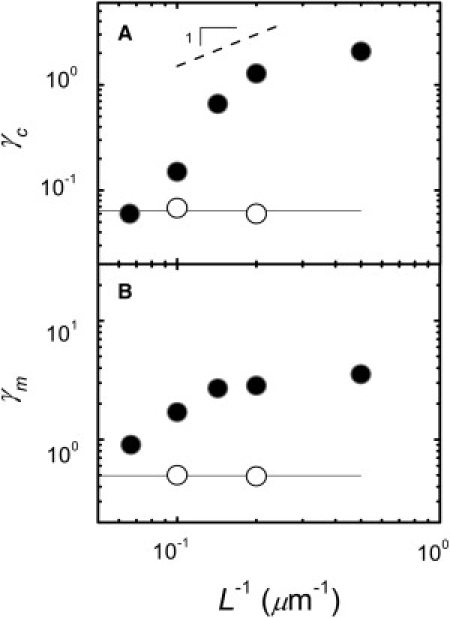
Dependence of the critical and maximum strains on L. Filamin with RF = 0.01 (solid). Rigid cross-links with RB = 0.01 (open). (A) The value γc of the filamin networks increases with increasing L−1. In contrast, γc for rigidly cross-linked networks is independent of L, with mean value denoted (solid line). (B) The value γm versus L−1.
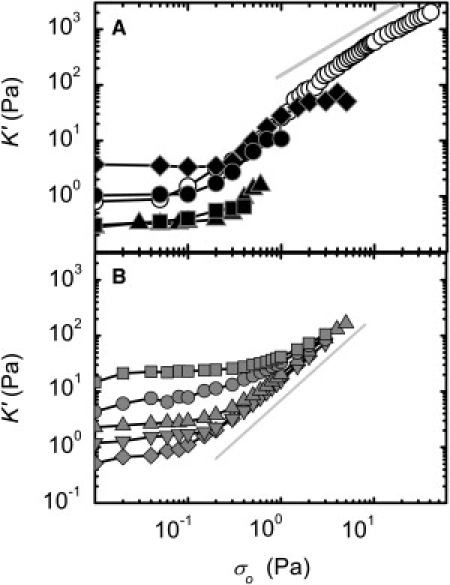
Nonlinear stiffening in prestress measurements. (A) Filamin networks with RF = 0.003 and L = 1 (squares), 5 (triangles), 15 μm (solid circles); RF = 0.005 with L = 15 μm (diamonds); and RF = 0.01 with L = 15 μm (open circles, bundled network). K′ is independent of prestress, σo, for small prestresses before beginning to increase with σo at a critical stress, σc. Networks with higher RF and L stiffen more and support larger stresses before breaking. (Line) Linear scaling predicted by the model. (B) Rigidly cross-linked network with L = 15 μm and RB = 0.0003 (diamonds), 0.001 (inverted triangles), 0.003 (triangles), 0.03 (circles), and 0.3 (squares). These networks also display stiffening behavior, but the maximum stiffness and stress are roughly the same for every sample. (Line) The σo3/2 scaling predicted by the affine thermal model.
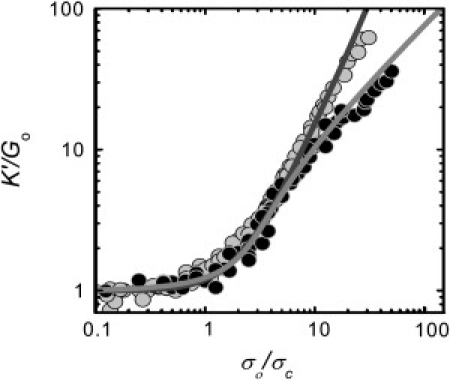
Rescaled nonlinear stiffening of nonbundled networks with filamin (solid) or rigid cross-links (light shaded) at various values of RF or RB, L, and cA. Filamin data is consistent with model of rigid rods connected by flexible linkers (20) (medium shaded line), while rigid cross-linking data is consistent with model of semiflexible filaments connected by rigid linkers (5) (dark shaded line).
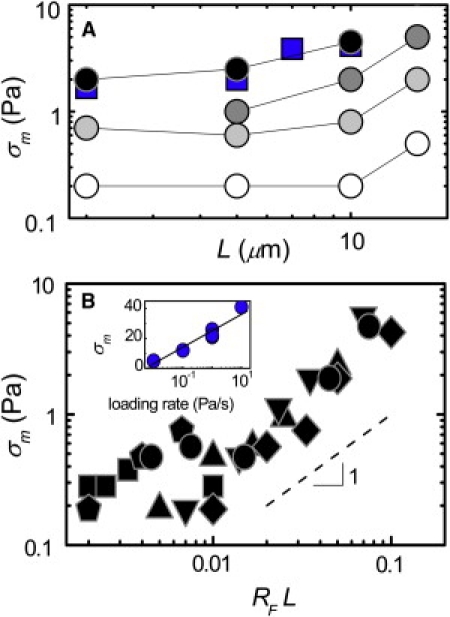
Scaling of the maximum stress, σm, with L for nonbundled filamin networks. (A) The value σm increases with L. From prestress measurements (circles) or 0.1/s strain ramps (squares): RF = 0.001 (open), 0.003 (light shaded), 0.005 (medium shaded), and 0.01 (solid). (B) The value σm for samples of different compositions collapse onto a single curve when plotted versus RFL. Above RFL = 0.01, the data scale roughly linearly with RFL. L = 15 (circles), 10 (diamonds), 7 (inverted triangles), 5 (triangles), 2 (pentagons), and 1 (squares) μm. (Inset) The value σm grows as the logarithm of loading rate in stress ramps for networks with L = 15 μm, RF = 0.005.
References
-
- Humphrey D., Duggan C., Käs J. Active fluidization of polymer networks through molecular motors. Nature. 2002;416:413–416. - PubMed
-
- Mizuno D., Tardin C., Mackintosh F.C. Nonequilibrium mechanics of active cytoskeletal networks. Science. 2007;315:370–373. - PubMed
-
- Gardel M.L., Shin J.H., Weitz D.A. Elastic behavior of cross-linked and bundled actin networks. Science. 2004;304:1301–1305. - PubMed
Publication types
MeSH terms
Substances
Grants and funding
LinkOut - more resources
Full Text Sources
