

Three-color spectral FRET microscopy localizes three interacting proteins in living cells
- PMID: 20713013
- PMCID: PMC2920763
- DOI: 10.1016/j.bpj.2010.06.004
Three-color spectral FRET microscopy localizes three interacting proteins in living cells
Abstract
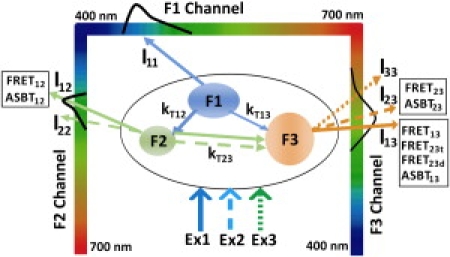
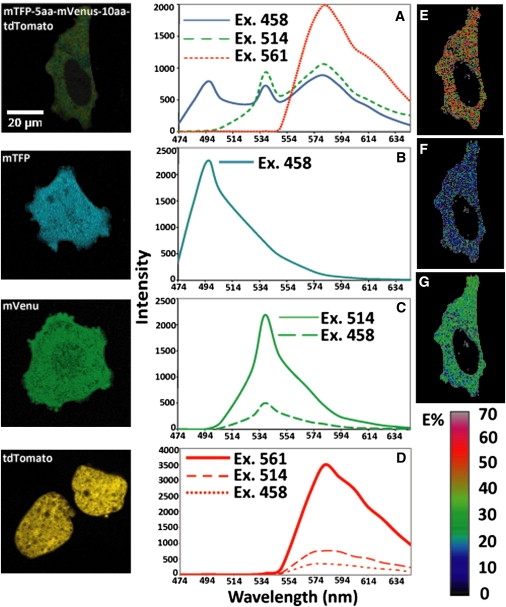
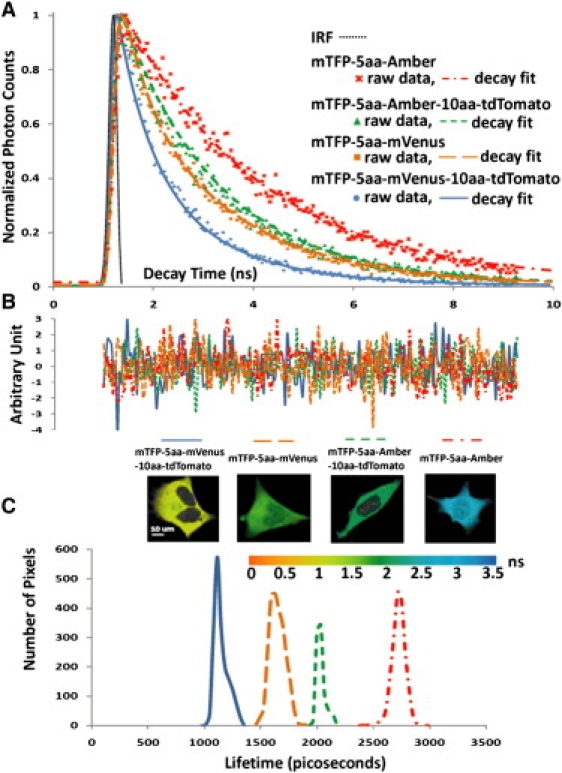
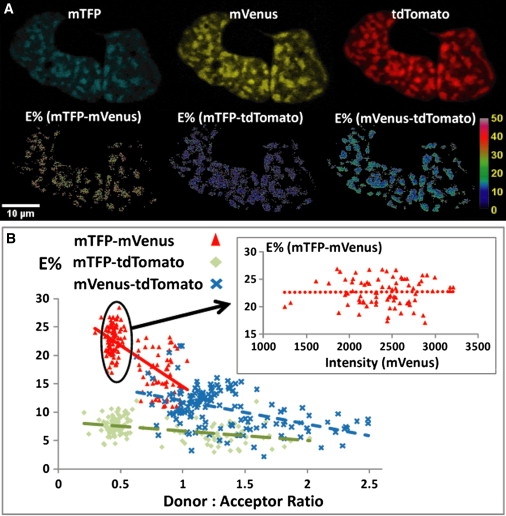
FRET technologies are now routinely used to establish the spatial relationships between two cellular components (A and B). Adding a third target component (C) increases the complexity of the analysis between interactions AB/BC/AC. Here, we describe a novel method for analyzing a three-color (ABC) FRET system called three-color spectral FRET (3sFRET) microscopy, which is fully corrected for spectral bleedthrough. The approach quantifies FRET signals and calculates the apparent energy transfer efficiencies (Es). The method was validated by measurement of a genetic (FRET standard) construct consisting of three different fluorescent proteins (FPs), mTFP, mVenus, and tdTomato, linked sequentially to one another. In addition, three 2-FP reference constructs, tethered in the same way as the 3-FP construct, were used to characterize the energy transfer pathways. Fluorescence lifetime measurements were employed to compare the relative relationships between the FPs in cells producing the 3-FP and 2-FP fusion proteins. The 3sFRET microscopy method was then applied to study the interactions of the dimeric transcription factor C/EBPalpha (expressing mTFP or mVenus) with the heterochromatin protein 1alpha (HP1alpha, expressing tdTomato) in live-mouse pituitary cells. We show how the 3sFRET microscopy method represents a promising live-cell imaging technique to monitor the interactions between three labeled cellular components.
2010 Biophysical Society. Published by Elsevier Inc. All rights reserved.
Figures
Similar articles
-
Measuring protein interactions using Förster resonance energy transfer and fluorescence lifetime imaging microscopy.Methods. 2014 Mar 15;66(2):200-7. doi: 10.1016/j.ymeth.2013.06.017. Epub 2013 Jun 24. Methods. 2014. PMID: 23806643 Free PMC article.
-
Unraveling transcription factor interactions with heterochromatin protein 1 using fluorescence lifetime imaging microscopy and fluorescence correlation spectroscopy.J Biomed Opt. 2013 Feb;18(2):25002. doi: 10.1117/1.JBO.18.2.025002. J Biomed Opt. 2013. PMID: 23392382 Free PMC article.
-
Characterization of an improved donor fluorescent protein for Forster resonance energy transfer microscopy.J Biomed Opt. 2008 May-Jun;13(3):031203. doi: 10.1117/1.2939094. J Biomed Opt. 2008. PMID: 18601527 Free PMC article.
-
Fluorescence resonance energy transfer microscopy: a mini review.J Biomed Opt. 2001 Jul;6(3):287-91. doi: 10.1117/1.1383063. J Biomed Opt. 2001. PMID: 11516318 Review.
-
Monitoring protein interactions in living cells with fluorescence lifetime imaging microscopy.Methods Enzymol. 2012;504:371-91. doi: 10.1016/B978-0-12-391857-4.00019-7. Methods Enzymol. 2012. PMID: 22264545 Free PMC article. Review.
Cited by
-
N-way FRET microscopy of multiple protein-protein interactions in live cells.PLoS One. 2013 Jun 6;8(6):e64760. doi: 10.1371/journal.pone.0064760. Print 2013. PLoS One. 2013. PMID: 23762252 Free PMC article.
-
Three-Fluorophore FRET Enables the Analysis of Ternary Protein Association in Living Plant Cells.Plants (Basel). 2022 Oct 6;11(19):2630. doi: 10.3390/plants11192630. Plants (Basel). 2022. PMID: 36235497 Free PMC article.
-
Application of FRET Biosensors in Mechanobiology and Mechanopharmacological Screening.Front Bioeng Biotechnol. 2020 Nov 9;8:595497. doi: 10.3389/fbioe.2020.595497. eCollection 2020. Front Bioeng Biotechnol. 2020. PMID: 33240867 Free PMC article. Review.
-
Genetically Encoded Fluorescence Barcodes Allow for Single-Cell Analysis via Spectral Flow Cytometry.ACS Synth Biol. 2025 May 16;14(5):1533-1548. doi: 10.1021/acssynbio.4c00807. Epub 2025 May 6. ACS Synth Biol. 2025. PMID: 40326708
-
Optimizing fluorescent protein trios for 3-Way FRET imaging of protein interactions in living cells.Sci Rep. 2015 Jul 1;5:10270. doi: 10.1038/srep10270. Sci Rep. 2015. PMID: 26130463 Free PMC article.
References
-
- Wallrabe H., Periasamy A. Imaging protein molecules using FRET and FLIM microscopy. Curr. Opin. Biotechnol. 2005;16:19–27. - PubMed
-
- Vogel S.S., Thaler C., Koushik S.V. Fanciful FRET. Sci. STKE. 2006;2006:re2. - PubMed
-
- Piston D.W., Kremers G.J. Fluorescent protein FRET: the good, the bad and the ugly. Trends Biochem. Sci. 2007;32:407–414. - PubMed
Publication types
MeSH terms
Substances
Grants and funding
LinkOut - more resources
Full Text Sources
Other Literature Sources
Miscellaneous
