. 2010 Aug 9;99(4):1303-10.
doi: 10.1016/j.bpj.2010.06.005.

Dynamic superresolution imaging of endogenous proteins on living cells at ultra-high density

Affiliations

Dynamic superresolution imaging of endogenous proteins on living cells at ultra-high density

Gregory Giannone et al. Biophys J. .

Abstract

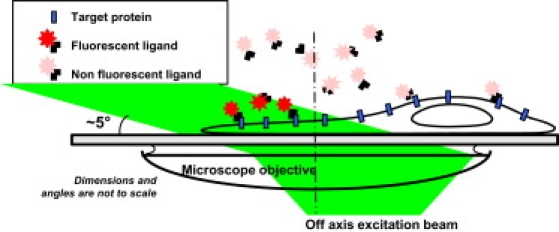
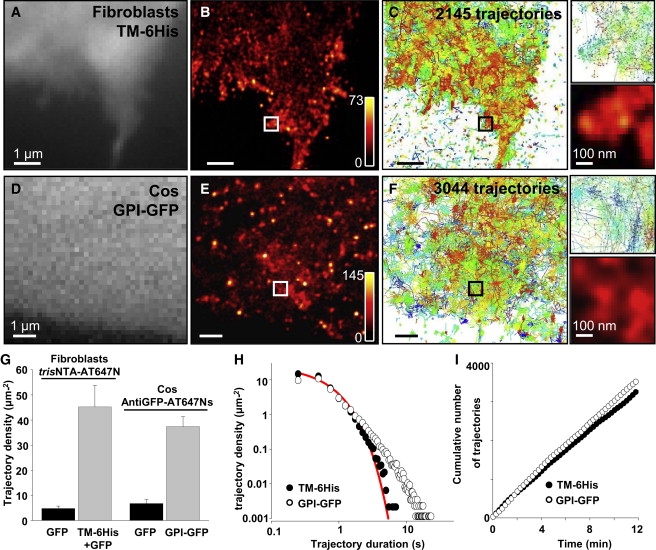
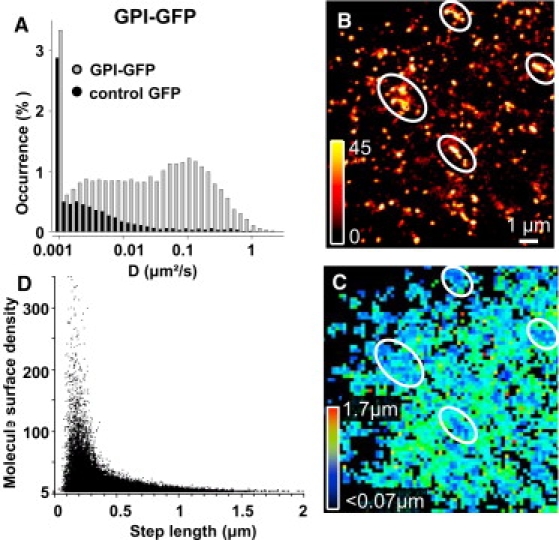
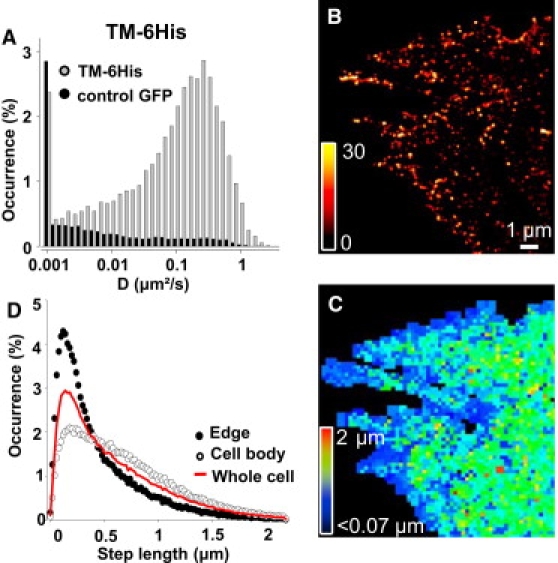
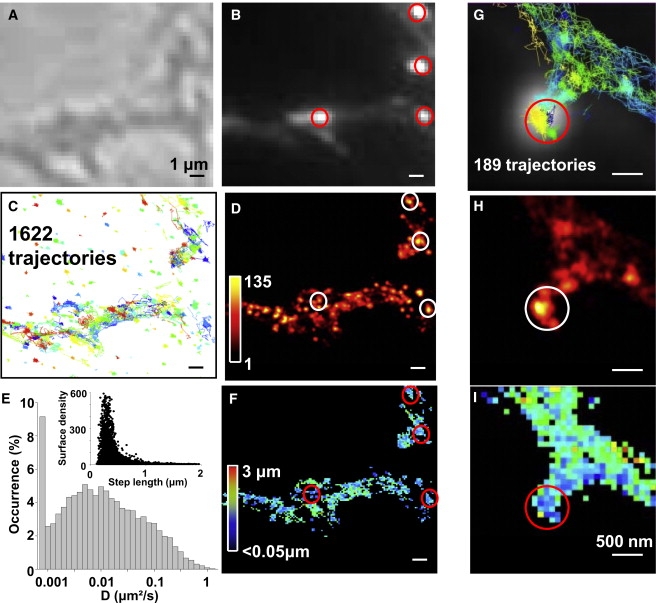
Versatile superresolution imaging methods, able to give dynamic information of endogenous molecules at high density, are still lacking in biological science. Here, superresolved images and diffusion maps of membrane proteins are obtained on living cells. The method consists of recording thousands of single-molecule trajectories that appear sequentially on a cell surface upon continuously labeling molecules of interest. It allows studying any molecules that can be labeled with fluorescent ligands including endogenous membrane proteins on living cells. This approach, named universal PAINT (uPAINT), generalizes the previously developed point-accumulation-for-imaging-in-nanoscale-topography (PAINT) method for dynamic imaging of arbitrary membrane biomolecules. We show here that the unprecedented large statistics obtained by uPAINT on single cells reveal local diffusion properties of specific proteins, either in distinct membrane compartments of adherent cells or in neuronal synapses.


Figures

Figure 1
Figure 1
Schematics of the experimental setup. A low concentration of fluorescent ligands is introduced in the extracellular medium such that a constant rate of membrane molecules is being labeled during the imaging sequence. Oblique illumination of the sample is used to excite predominantly fluorescent ligands that have bound to the cell surface while not illuminating the molecules in the above solution.
Figure 2
Figure 2
uPAINT imaging with two different ligand/receptor systems. (A) Wide-field fluorescence image of a fibroblast expressing TM-6His and GFP. (B) Superresolved image of TM-6His labeled with trisNTA-AT647N obtained by uPAINT and (C) corresponding trajectories. (DF) Same as panels AC, but for GPI-GFP labeled with anti-GFP-AT647Ns on a COS 7 cell. (G) Surface density of the trajectories recorded on TM-6His/GFP or GPI-GFP transfected cells (19,191 and 31,936 trajectories, respectively), and on GFP-transfected control cells for the two protein/ligand complexes (n = 4–5 cells in each condition). (H) Distributions of the trajectory lengths measured with trisNTA-AT647N and anti-GFP-ATTO-647Ns. (Solid line) Fit with an exponential curve. (I) Cumulative number of trajectories as a function of time for the two protein-ligand complexes.
Figure 3
Figure 3
Statistical analysis of GPI-GFP spatio-temporal localization on COS 7 cells. (A) Distribution of instantaneous diffusion constants for GPI-GFP on COS 7 cells. Control corresponds to cells expressing GFP alone. (B) Four microdomains presenting a high surface density of GPI-GFP are highlighted on a superresolved image. (C) Corresponding color-coded two-dimensional map of the mean GPI-GFP step lengths during 50 ms within 200 × 200 nm2 pixels. (D) Two-dimensional plot of the molecule densities as a function of mean step lengths measured within 200 × 200 nm2 pixels (n = 487,112 steps, five cells) revealing reduced movements in the high density regions.
Figure 4
Figure 4
Statistical analysis of TM-6His spatio-temporal localization on fibroblasts. (A) Distributions of instantaneous diffusion constants for TM-6His on fibroblasts. (B) Superresolved image and (C) corresponding color-coded two-dimensional map of the mean TM-6His step lengths during 50 ms within 200 × 200 nm2 pixels, revealing reduced movements at the cell edges. (D) Step-length distributions for TM-6His (n = 214,089 steps, n = 4) during 50 ms without localization information, at the cell edges and on the cell body.
Figure 5
Figure 5
uPAINT on endogenous AMPA receptors in live neurons. (A) Wide-field Nomarski and (B) fluorescence image of live neurons transfected with Homer1C::GFP to reveal postsynaptic sites (red outlines). (C) Trajectories (n = 1622) of GluR2 containing AMPARs labeled with antiGluR2-AT647Ns. (D) Superresolved image corresponding to panels AC. (E) Distributions of instantaneous diffusion constants (19,412 trajectories, 11 fields of view). (Inset) Two-dimensional plot of the molecule densities as a function of mean step lengths measured within 100 × 100 nm2 pixels revealing reduced movements in the high density regions. (F) Color-coded two-dimensional-map of the mean AMPARs step lengths during 50 ms within 100 × 100 nm2 pixels (n = 28,446 steps) corresponding to panels AD. (GI) Zoom on a dendritic spine, scale bar 500 nm. (G) Trajectories (n = 189) superimposed with fluorescent image of Homer1C::GFP. Corresponding superresolved image (H) and diffusion maps (I), as in panels E and F.

Comment in

  • uPAINTing the plasma membrane.
    de Souza N. de Souza N. Nat Methods. 2010 Oct;7(10):784. doi: 10.1038/nmeth1010-784. Nat Methods. 2010. PMID: 20936749 No abstract available.

References

    1. Hell S.W. Far-field optical nanoscopy. Science. 2007;316:1153–1158. - PubMed
    1. Kner P., Chhun B.B., Gustafsson M.G. Super-resolution video microscopy of live cells by structured illumination. Nat. Methods. 2009;6:339–342. - PMC - PubMed
    1. Manley S., Gillette J.M., Lippincott-Schwartz J. High-density mapping of single-molecule trajectories with photoactivated localization microscopy. Nat. Methods. 2008;5:155–157. - PubMed
    1. Westphal V., Rizzoli S.O., Hell S.W. Video-rate far-field optical nanoscopy dissects synaptic vesicle movement. Science. 2008;320:246–249. - PubMed
    1. Fujiwara T., Ritchie K., Kusumi A. Phospholipids undergo hop diffusion in compartmentalized cell membrane. J. Cell Biol. 2002;157:1071–1081. - PMC - PubMed

Publication types