Review
. 2010 Sep 27;365(1554):2973-89.
doi: 10.1098/rstb.2010.0158.

Implications of climate change for agricultural productivity in the early twenty-first century

Affiliations
Review

Implications of climate change for agricultural productivity in the early twenty-first century

Jemma Gornall et al. Philos Trans R Soc Lond B Biol Sci. .

Abstract

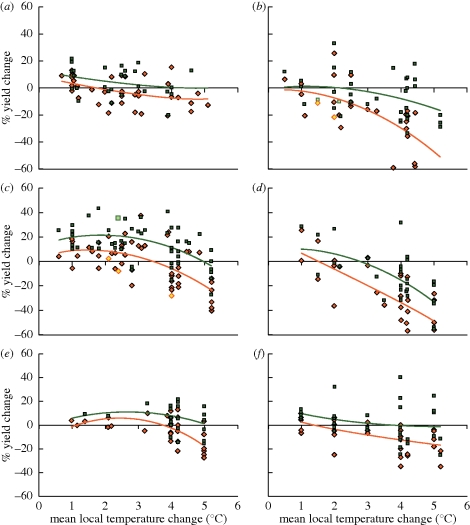
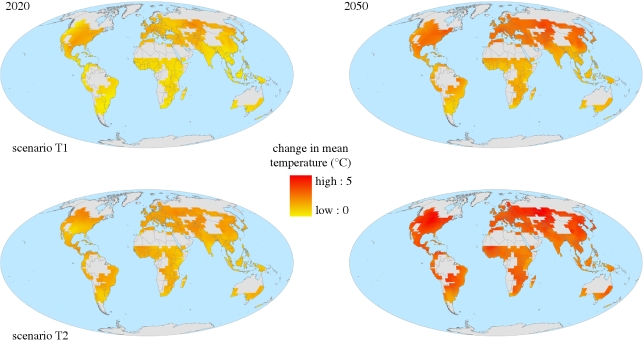
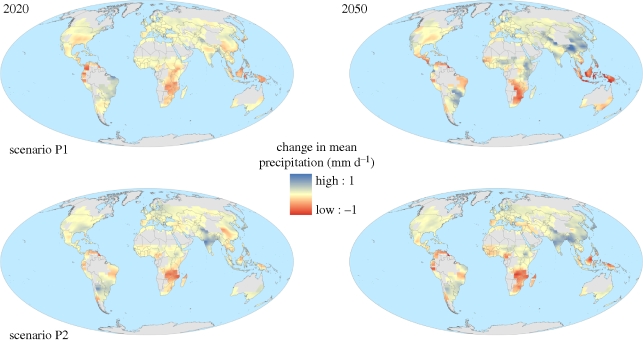
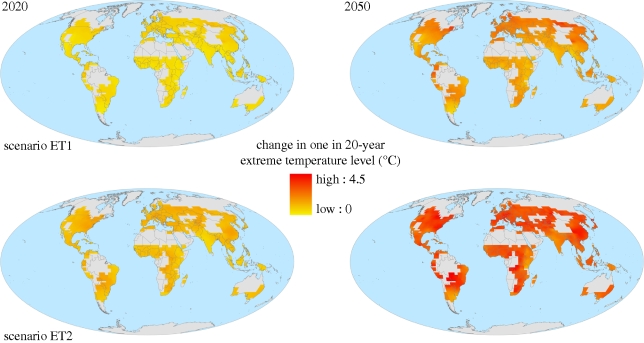
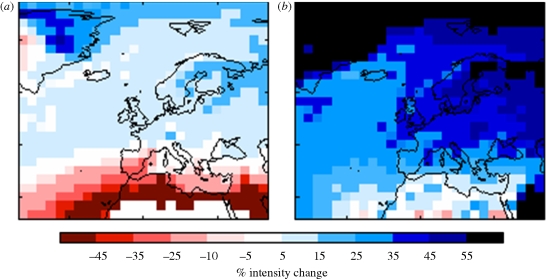
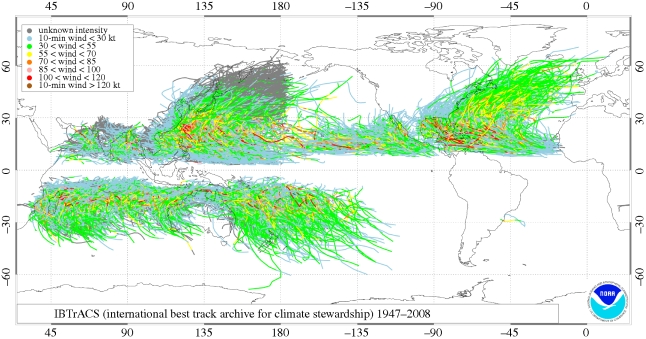
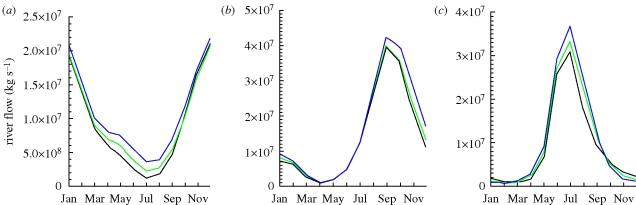
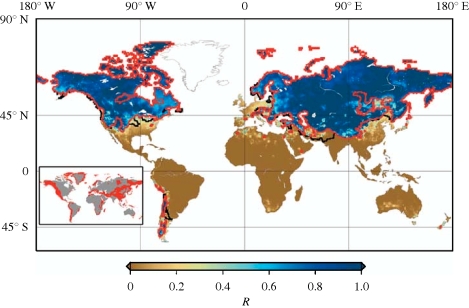
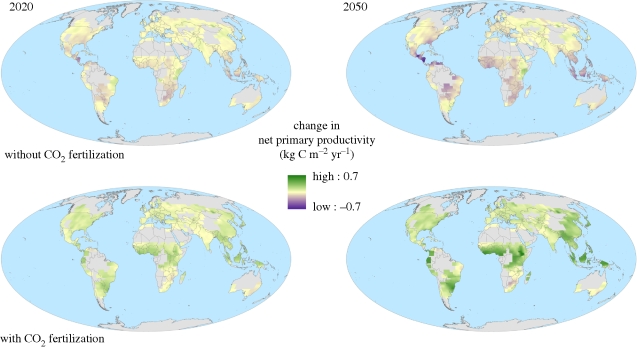
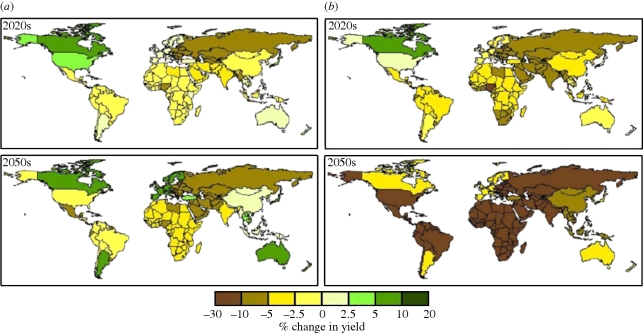
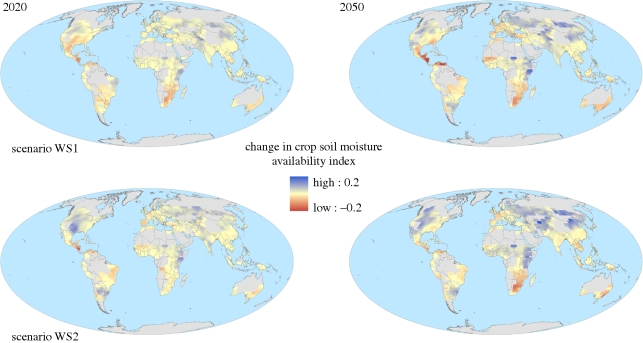
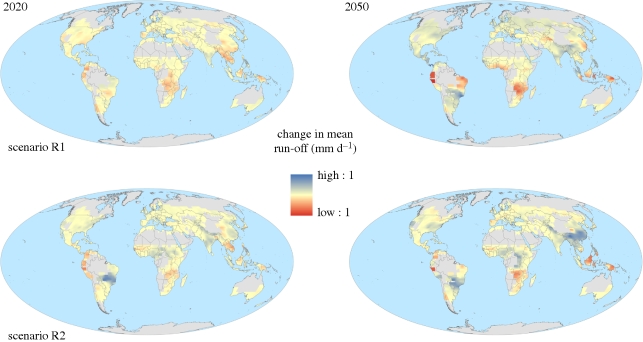
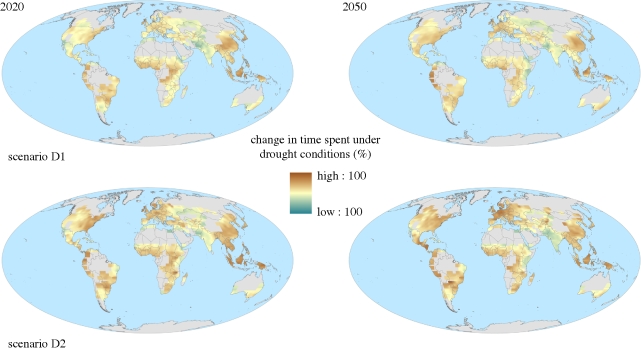
This paper reviews recent literature concerning a wide range of processes through which climate change could potentially impact global-scale agricultural productivity, and presents projections of changes in relevant meteorological, hydrological and plant physiological quantities from a climate model ensemble to illustrate key areas of uncertainty. Few global-scale assessments have been carried out, and these are limited in their ability to capture the uncertainty in climate projections, and omit potentially important aspects such as extreme events and changes in pests and diseases. There is a lack of clarity on how climate change impacts on drought are best quantified from an agricultural perspective, with different metrics giving very different impressions of future risk. The dependence of some regional agriculture on remote rainfall, snowmelt and glaciers adds to the complexity. Indirect impacts via sea-level rise, storms and diseases have not been quantified. Perhaps most seriously, there is high uncertainty in the extent to which the direct effects of CO(2) rise on plant physiology will interact with climate change in affecting productivity. At present, the aggregate impacts of climate change on global-scale agricultural productivity cannot be reliably quantified.


Figures

Figure 1.
Figure 1.
Sensitivity of cereal ((a,b) maize (mid- to high-latitude and low latitude), (c,d) wheat (mid- to high-latitude and low latitude) and (e,f) rice (mid- to high-latitude)) to climate change as determined from the results of 69 studies, against temperature change. Results with (green), and without (red) adaptation are shown. Reproduced from Easterling et al. (2007), fig. 5.2.
Figure 2.
Figure 2.
Two projections of change in annual mean temperature (°C) over global croplands for 30-year means centred around 2020 and 2050, relative to 1970–2000. The two projections are the members of the ensemble with the greatest and least change in annual mean temperature averaged over all global croplands. See the electronic supplementary material for further details.
Figure 3.
Figure 3.
Two projections of change in annual mean precipitation (mm d−1) over global croplands for 30-year means centred around 2020 and 2050, relative to 1970–2000. The two projections are the members of the ensemble with the most positive and negative changes in annual mean precipitation averaged over all global croplands. See the electronic supplementary material for further details.
Figure 4.
Figure 4.
Two projections of change in one in 20-year extreme temperature level (°C) over global croplands for 2020 and 2050, relative to 2000. The two projections are the members of the ensemble with the greatest and least change averaged over all global croplands. See the electronic supplementary material for further details.
Figure 5.
Figure 5.
(a) Lower and (b) upper estimates covering the central 80% range of changes in precipitation intensity on wet days with a 1 year return period for a doubling of CO2.
Figure 6.
Figure 6.
Observed tropical cyclone tracks and intensity for all known storms over the period 1947–2008. Tracks are produced from the IBTrACS dataset of NOAA/NCDC (Knapp et al. 2010).
Figure 7.
Figure 7.
Projected mean monthly river flow (kg s−1) for 30 year means centred on 2000 (black), 2020 (green) and 2050 (blue) for the (a) Nile, (b) Ganges and (c) Volga. Projections are bias corrected ensemble means from the Hadley Centre models. See the electronic supplementary material for further details.
Figure 8.
Figure 8.
The fraction of run-off originating as snowfall. The red lines indicate the regions where streamflow is snowmelt-dominated, and where there is not adequate reservoir storage capacity to buffer shifts in the seasonal hydrograph. The black lines indicate additional areas where water availability is predominantly influenced by snowmelt generated upstream (but run-off generated within these areas is not snowmelt-dominated). Reproduced from Barnett et al. (2005) with permission from Macmillan Publishers Ltd: Nature.
Figure 9.
Figure 9.
Two projections of future change in net primary productivity (kg C m−2 yr−1) over global croplands for 30-year means centred around 2020 and 2050, relative to 1970–2000. The two projections show the impact of including CO2 physiological effects and are the members of the ensemble with the most positive and negative changes in productivity averaged over all global croplands. See the electronic supplementary material for further details.
Figure 10.
Figure 10.
Potential changes (%) in national cereal yields for the 2020s and 2050s relative to 1990, with climate change projected by the HadCM3 model under the A1FI scenario (a) with and (b) without CO2 fertilization. Reproduced from Parry et al. (2004) with permission from Elsevier.
Figure 11.
Figure 11.
Two projections of future change in soil moisture as a fraction of that required to prevent plant water stress over global croplands for 30-year means centred around 2020 and 2050, relative to 1970–2000. Positive values indicate increased water availability. The two projections are the members of the ensemble with the greatest and least change averaged over all global croplands. See the electronic supplementary material for further details.
Figure 12.
Figure 12.
Two projections of future change in annual mean run-off (mm d−1) over global croplands for 30-year means centred around 2020 and 2050, relative to 1970–2000. The two projections are the members of the ensemble with the most positive and negative changes in annual mean run-off averaged over all global croplands. See the electronic supplementary material for further details.
Figure 13.
Figure 13.
Two projections of percentage change in time spent under meteorological drought as defined in terms of soil moisture in global croplands for 30-year means centred around 2020 and 2050, relative to 2000. The two projections are the members of the ensemble with the greatest and least percentage change averaged over all global croplands. See the electronic supplementary material for further details.

References

    1. Abou-Hadid A. F., Mougou R., Mokssit A., Iglesias A.2003Assessment of impacts, adaptation and vulnerability to climate change in North Africa: food production and water resources. AIACC AF90 Semi-Annual Progress Report.
    1. Abtew W., Pathak C., Scott Huebner R., Ciuca V.2009Hydrology of the South Florida Environment. In 2009 South Florida Environmental Report, South Florida Water Management District, West Palm Beach, FL. vol. I, ch. 2.
    1. Ainsworth E. A., Long S. P.2005What have we learned from 15 years of free-air CO2 enrichment (FACE)? A meta-analytic review of the responses of photosynthesis, canopy. New Phytol. 165, 351–371 (doi:10.1111/j.1469-8137.2004.01224.x) - DOI - PubMed
    1. Alcamo J., Dronin N., Endejan M., Golubev G., Kirilenkoc A.2007A new assessment of climate change impacts on food production shortfalls and water availability in Russia. Global Environ. Change—Hum. Policy Dimens. 17, 429–444
    1. Alexandrov V., Eitzinger J., Cajic V., Oberforster M.2002Potential impact of climate change on selected agricultural crops in north-eastern Austria. Global Change Biol. 8, 372–389 (doi:10.1046/j.1354-1013.2002.00484.x) - DOI

LinkOut - more resources