

Food waste within food supply chains: quantification and potential for change to 2050
- PMID: 20713403
- PMCID: PMC2935112
- DOI: 10.1098/rstb.2010.0126
Food waste within food supply chains: quantification and potential for change to 2050
Abstract
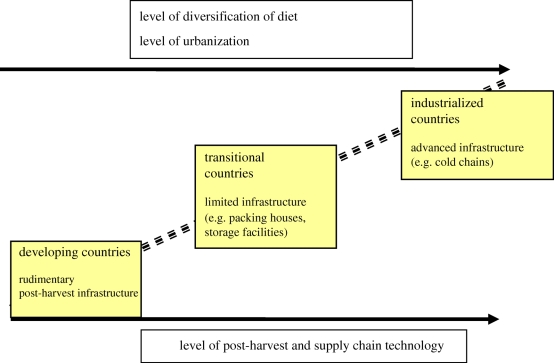
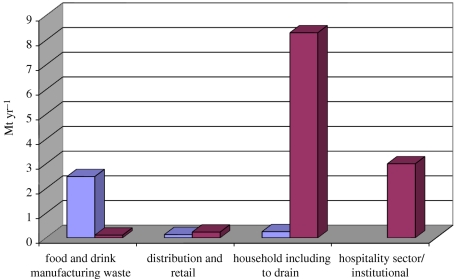
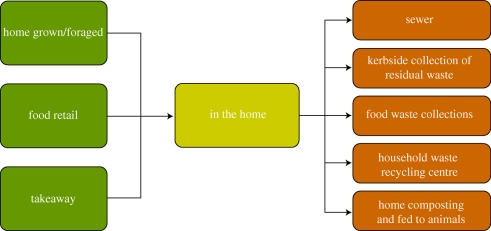
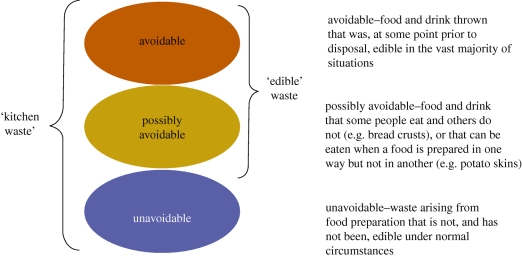
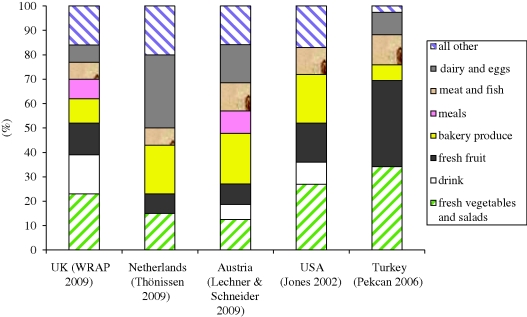
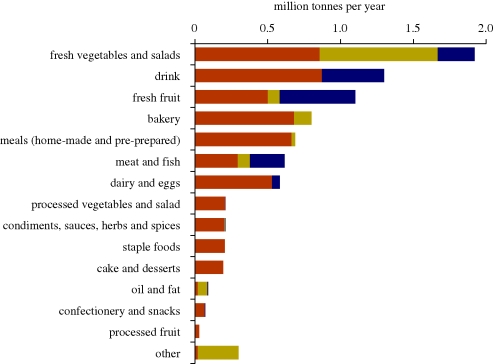
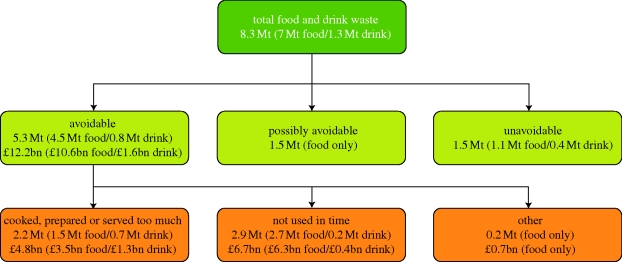
Food waste in the global food supply chain is reviewed in relation to the prospects for feeding a population of nine billion by 2050. Different definitions of food waste with respect to the complexities of food supply chains (FSCs)are discussed. An international literature review found a dearth of data on food waste and estimates varied widely; those for post-harvest losses of grain in developing countries might be overestimated. As much of the post-harvest loss data for developing countries was collected over 30 years ago, current global losses cannot be quantified. A significant gap exists in the understanding of the food waste implications of the rapid development of 'BRIC' economies. The limited data suggest that losses are much higher at the immediate post-harvest stages in developing countries and higher for perishable foods across industrialized and developing economies alike. For affluent economies, post-consumer food waste accounts for the greatest overall losses. To supplement the fragmentary picture and to gain a forward view, interviews were conducted with international FSC experts. The analyses highlighted the scale of the problem, the scope for improved system efficiencies and the challenges of affecting behavioural change to reduce post-consumer waste in affluent populations.
Figures
References
-
- Baek W.2009Change of MSW composition attributed by ban on direct landfill of food waste in Korea. Presentation to the 7th Workshop on GHG Inventories in Asia (WGIA7), 7 July 2009. South Korea: Environmental Management Corporation
-
- Bennett M. K.1941Wheat studies of the Food Research Institute, vols 12 and 18 Stanford, CA: Stanford University
-
- Blond R. D.1984The agricultural development systems project in Egypt, pp. 42–48, 190–194 Davis, CA: University of California, Davis
-
- Brook Lyndhurst 2007Food behaviour consumer research—findings from the quantitative survey. Briefing Paper UK: WRAP
-
- Cathcart E. P., Murray A. M.1939A note on the percentage loss of calories as waste on ordinary mixed diets. J. Hyg. 39, 45–50 (doi:10.1017/S0022172400011670) - DOI - PMC - PubMed
Publication types
MeSH terms
LinkOut - more resources
Full Text Sources
Other Literature Sources
Research Materials
Miscellaneous
